
It’s the start of a calendar year. Let’s take a look at what 2023 did to me financially. I’m following the same structure I’ve used for the last few years (2022, 2021, and 2020). Overall, 2023 was a good year on almost all measures – thanks in particular to Q4 which saw the US stock market drag the year into a top quartile performance.
Q1 How did markets do?
First of all, what happened out there? Well, the year felt pretty ‘meh’ for the first nine months – as illustrated by my rather depressed blog post in mid October. But almost as soon as I hit Publish, the US market in particular led a dramatic recovery – reflecting a sharply improved outlook for inflation and interest rates. You can see below firstly the performance in December.
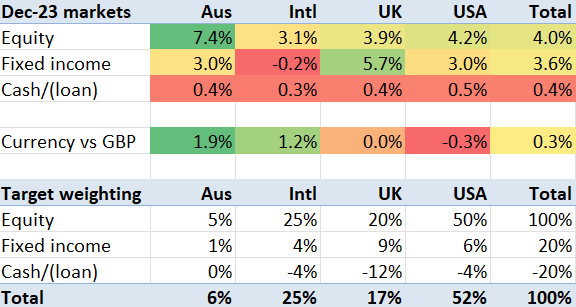
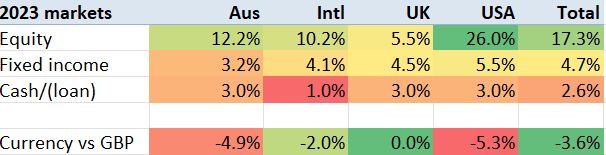
Then we get to the year as a whole. Bonds rose by 3-5% across the board, but equities did strikingly better – particularly in the USA where the S&P500 rose around 26%. The UK equity market looks like the runt of the litter, which given the tech-driven nature of the uptick and the lack of UK tech wouldn’t be a big surprise. However it isn’t quite that simple, because the GBP rose against most currencies.
Another way to look at the benchmarks is to look at the world equities (e.g. VWRL) and world bonds (e.g. AGG/BND or the UK’s IGLT). My portfolio has often pretty closely tracked the VWRL ETF. The graph below shows VWRL and IGLT’s share prices (but not dividends) for the year, showing the world equity bundle up (in GBP) 13.4% and the UK government bond index roughly flat.

Q2 How did I do, vs my benchmark?
Against that backdrop – bonds up a bit, equities up considerably more especially in the USA, how did my portfolio perform?
My portfolio was significantly leveraged throughout 2023. This was increasingly expensive. By the second half of the year, my cost of funds had risen to around 6%. But even with markets rising so much, in theory my leverage should have helped me. My leverage dropped from around 25% to around 20% during the year, but that should still have enabled me to outperform.
And outperformance is very much what happened – my portfolio rose by over 20% in 2023. This is around 50% faster than the market – even more than the leverage would have suggested. My tech exposure (with GOOG, AMZN, MSFT and ADBE all being long held positions) proved very helpful. My average annual return since I began tracking 11 years ago has risen to 9.0% per year. 2023 was the third best year of the last 11 for me.

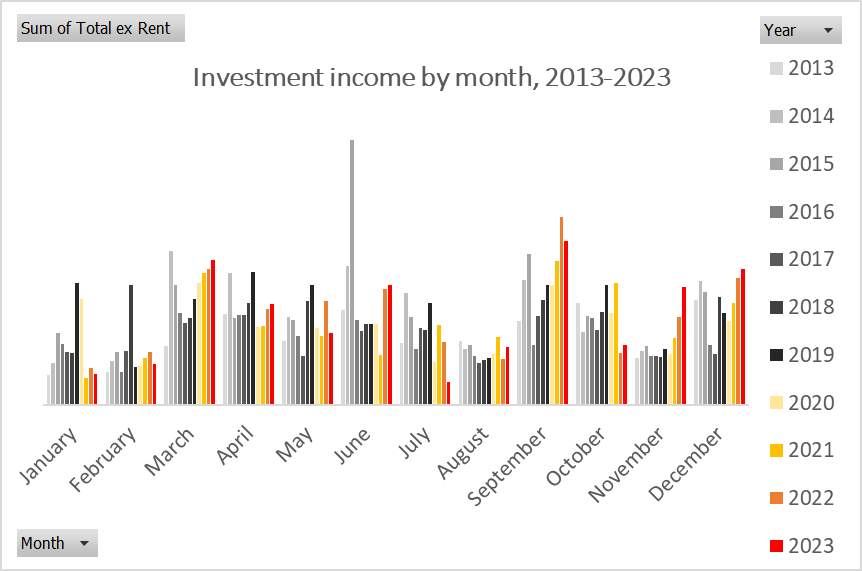
Another key metric for me is the investment income I receive. My portfolio income (i.e. dividends) varies considerably by month. I like using the ‘Weenie graph‘ to visualise it, which makes it easy to compare each month to that month in previous years. 2023 was pretty solid for dividends, but actually slightly smaller than 2022 – due to a couple of funny months July and September.
In fact my total investment income comes not only from my investment portfolio, but also from other sources – notably a residential rental property. The total investment income is shown in the graph below – and shown relative to my salary/employment income. Note that I include the income within my SIPP (though not my other pension accounts, which I can’t track fully) within my tracking – which is unusual in the blogosphere. I also show the capital gains I realised in 2023 – a smaller number, but not immaterial in the scheme of things.
Historically I would have reinvested all this investment income. However 2023 saw my cost of living (including my debt interest costs, some off balance sheet investments, pension contributions, travel extravagances and such like) exceed my taxable employment income, so I found myself dipping into the investment income on a regular basis. This does not feel great to me – as reflected in my ‘feeling broke’ blog post – though I do remain very much in control of matters. Almost all my remaining income in unsheltered accounts went on paying debt interest and repayments.
Which brings me to my debt, and the other two key metrics that I track. I will tackle the overall leverage level in a moment, but let’s start with the interest expense. With base rates having risen to 5%+ in both the UK and the USA, my interest expenses reached unprecedented levels in 2023. My annual interest bill is now a six figure sum. Nonetheless, by making some loan repayments I have reduced the annual interest bill materially in the last three months – as shown in the graph below. My expectation is that rates will not rise further, allowing me to continue to pay off my debt and reduce my interest expense in both absolute and relative terms.

Q3 What is my progress towards my retirement goals?
My next question is one I have never been very good at answering – how am I progressing against my retirement goals? I don’t have very clear retirement goals. Putting that another way, my decision when to retire will not be much influenced by my finances; I am already sufficiently wealthy not to need to work under any reasonable scenario, so the decision whether / where to work is based on other factors – like who I work with, what the opportunity cost is, etc.
Nonetheless, there are a couple of ways in which I do not feel fully ‘ready’ financially – even if this isn’t very rational. One of those is my personal pension. Or more to the point, not my personal pension but Mrs FvL’s pension.
My own pension has been roughly at the tax limit (around £1.1m) for a year or two now. And though the UK government recently abolished that limit, it has retained a cap of £10k for how much high earners (such as me) can tax-efficiently contribute to a pension. So my own pension is ‘retirement ready’ – there is really no incentive to keep topping it up further, and an unintended consequence of UK government policy is to encourage me to stop working.
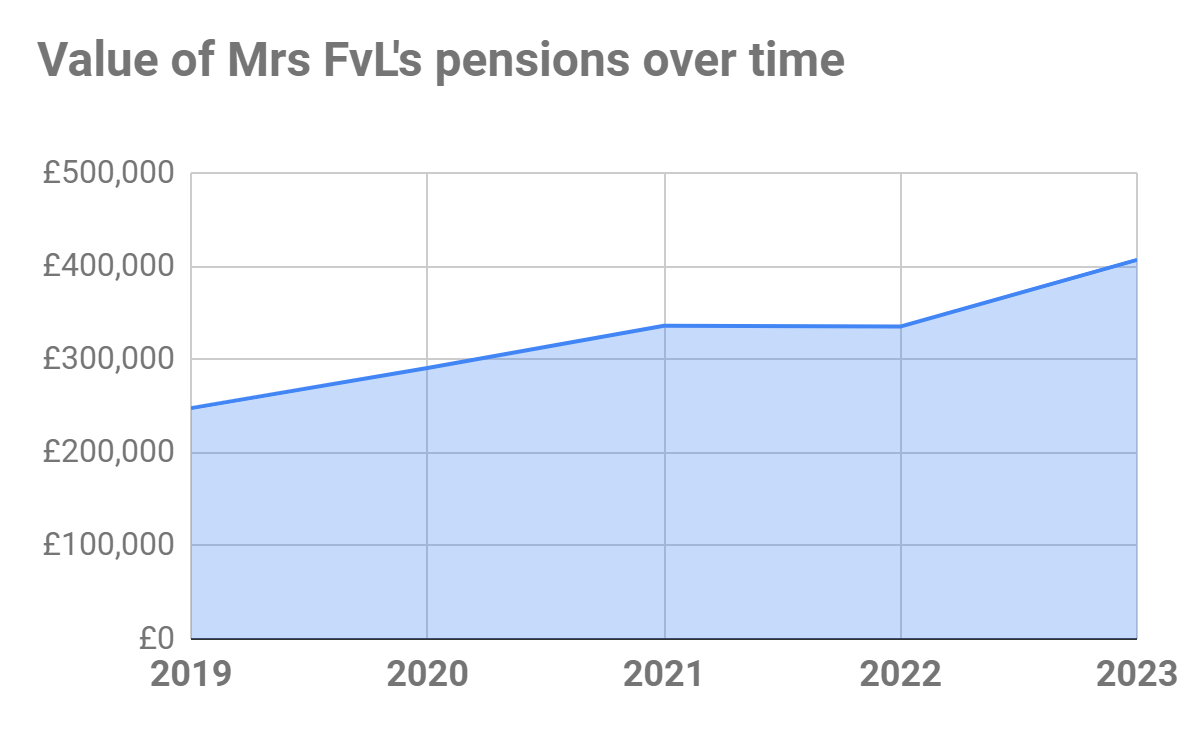
Mrs FvL’s pension, on the other hand, is a different matter. Her pension not only remains far below the recently-abolished size limit, but her income is a lot lower than mine too – meaning the amount she/we can tax-efficiently contribute to her pension is much higher – and in fact has increased to £60k per year. We are currently contributing around £20k per year to her pension; at this level her pension is growing only fairly slowly (see graph below). Nonetheless on the current trajectory she is roughly on track to see her pension grow to the £1m level before she hits the conventional retirement age.
If we increased our contributions to her pension to the £60k level and policy remained unchanged we would expect her pension to exceed mine in 10-20 years’ time. What is holding me back from doing this is that I perceive pensions’ tax advantages to be fairly weak when you allow for the lack of flexibility and vulnerability to government tax policy changes. I’d welcome readers’ opinions on what they’d do in our situation.
Q4 How tax efficient is my portfolio?
Talking of tax policy, that brings me to my next annual self-check question: how tax-efficient is my portfolio?
Regular readers will know that I never withdraw funds from my tax-free accounts. In the case of my pensions, that is because I am legally unable to until I hit retirement age, and in the case of my ISAs I see the tax advantage as so strong I will do everything I can do leave the investments in those accounts free to compound up indefinitely (and reasonably successfully).
My approach results in my tax efficiency changing really from two things. Firstly, I am topping up my tax-free ISA/SIPP accounts every year. As most of this comes from my unsheltered accounts, this results in a slow shift in my portfolio mix towards the tax-free accounts. This of course assumes that my holdings in my various accounts all generate approximately equal returns – i.e. that each account grows in line with each other.
The second thing that changes my tax efficiency is withdrawals or injections from my (taxable) portfolio. The main withdrawals in the last 10+ years have been to fund house purchases. The main injections have been windfalls from my angel investing portfolio. In the last couple of years I have had very few windfalls, and plenty of withdrawals, which serves to reduce the proportion of my portfolio in taxable accounts.
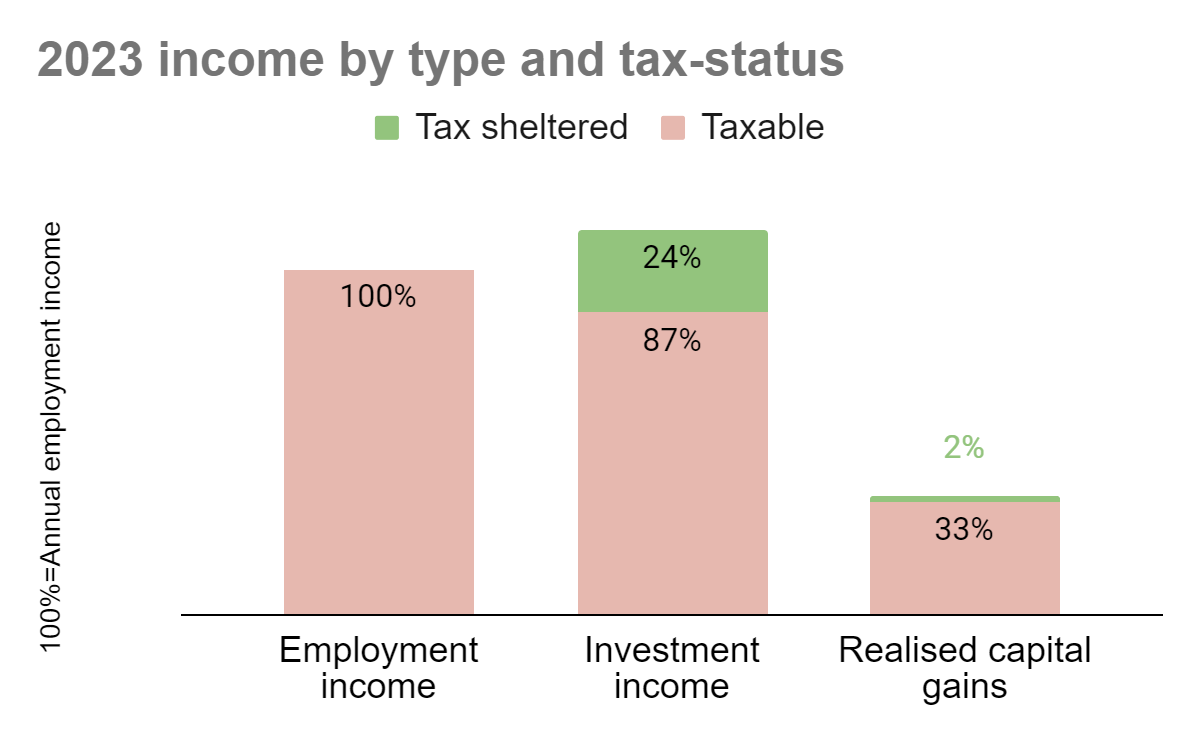
In 2023, the tax efficiency of my portfolio barely shifted from 2022 – as shown in the graph below. Alas, my marginal tax rate on taxable income is now 45% – the ‘additional’ (highest) rate in England & Wales. Nonetheless, taking the weighted average tax rate across all my (and Mrs FvL’s) accounts, my dividend income tax rate is around 30%.

Q5 What fees am I paying?
They say the only two certainties in life are death and taxes. I would add a third: investment fees. But while fees may be certain, their level is largely under our control.
The largest single set of fees I pay are to the private bank which holds a minority of my portfolio. Though it only holds around a quarter of my funds, it accounts for over half of my total fee expenses. Nonetheless, my fees (ignoring interest) fell slightly in 2023 as a % of my total portfolio. My total fees amount to 0.47% of my total AUM; while this is tens of thousands of pounds, it is a) pretty competitive versus any ‘professsionally’ managed portfolio and b) not too significant a drag on my portfolio returns (of 9.0% per year, on average). Of course when you compare these fees to the level of income generated by the portfolio, you gulp. In fact if you compare them to the taxable income you might choke – but hardly anybody does that!

Q6 How complex is my portfolio?
The next question, and one I have been taking increasingly seriously since 2020, is how complex is my portfolio. I took significant steps in 2020 to simplify the portfolio. And I doubled down again in early 2023. This has left me with fewer than 100 unique holdings, and only five ‘small’ holdings. I do still have 64 unique holdings in unwrapped accounts, despite aiming since 2021 for max 50. My direction of travel here is actually now in the wrong direction – especially since I have started buying individual gilts directly (though nowhere near enough to create a full ladder).

I also wanted to have no more than 20 holdings in multiple accounts; on this measure I am failing woefully, because I still have about 50 holdings that are held in 2+ accounts. A slight consolation is that I ‘only’ have 25 holdings in 3+ accounts. Even looking just at my accounts (and not Mrs FvL’s), I have around 40 holdings in 2+ accounts. Too many. Though harder to reduce than it sounds, because often I want to hold something in a tax-free account (which I can’t top up, easily) and then also want to hold more – which goes in an unsheltered account.
Q7 What key risks am I taking?
Finally, I ask myself what risks I am running. Obviously all investments carry risk – the best ones carry masses – but what additional risks do I run beyond particular investments?
I start this assessment by looking at my leverage. I have occasionally ran at a risky level of leverage. But one of the blessings of 2023 is that I consider my leverage level to have dropped to a level (see graph below) where my debt no longer poses a real risk to me. It costs me real money, but the chances that I am forced to sell assets outside my control is now extremely small. My total loans amount to around 17% of the total value of my portfolio’s holdings. If you took just my margined accounts, and if they lost half their value overnight, I would still not expect a margin call (in which I had to sell assets to maintain an acceptable level of debt). And I have several accounts which are unsheltered, but also not currently margined at all – so they provide a very real safety buffer on top.

With interest rates as high as 6%, there is very little advantage in leverage in a world where returns average 8-9% and dividend yields are around 3%. So while I have resisted (fortunately) an abrupt sell-off to reduce my leverage, I will continue slowly to bring my target LTV down – to at least 10% and maybe lower (over the next couple of years, I expect). I don’t see it going down to zero though, as the flexibility that margin loans provide remains something I still value significantly – even though it is not what it used to be at IBKR.
Moving on from leverage, another risk I worry about is one of my providers having a problem. In theory, one’s accounts are client funds – and not to be used by the broker/provider. In practice, as example after example over the years has shown, it pays to be careful.
I remain diversified across platform providers, and I also have taken steps to diversify across ETF providers. The graph below shows my exposure to fund/ETF providers. Blackrock’s iShares is my most common provider – they hold just over a quarter of my assets. Vanguard is not too far behind them. Lyxor is next, but with less than 5% of my money. So I am exposed if Vanguard or Blackrock suffered a major problem (such as a cyber attack, or a very fat finger, or worse), but not in a lifechanging way. If iShares and Vanguard were to be taken down simultaneously I would have a very big problem. Let’s hope that doesn’t happen.

In conclusion
Wrapping up, it has been a good year. I resisted the tempation to sell assets to reduce leverage while markets were low. And though my interest expenses rose to uncomfortable levels, this call has paid off for me – I have been able to reduce my leverage to 17% LTV, and start reducing my interest expense, while benefiting from a 20% increase in my portfolio’s net value. Meanwhile, fees, complexity and tax efficiency have all either held steady or improved slightly during the year.
2024 will doubtless hold its share of surprises but I feel that I enter it with considerably more resilience and flexibility than I entered 2023. Bring it on.
UPDATED 3/1/24 to correct the point about investment income from outside the portfolio; originally I said this comes from both residential and commercial property but in fact the figures shown above do not include any commercial property income.
Appendix: Media during the month


I think Vanguard and Blackrock are definitely in the “too big to fail”/”systemically important” camp, so exposure to them via ETF’s does not really overly concern me.
Exposure to IBKR on the other hand does keep me awake some nights (the probability of something happening, whilst low, is certainly not zero – e.g. they took a decent hit when oil futures went negative a few years ago)… Client assets should be segregated etc, but there’s no real way to test that until the tide actually goes out…
LikeLiked by 1 person
“Notably rental properties (both residential and commercial)”. Interesting you hold these given the management intensity, low yields and penal tax treatment.
On the residential in particular, it is not unusual to find the BTL mortgage rate at refinance is higher than the net property yield. This could be offset by rental growth but it is not a good place to start from.
Are you planning to sell these as part of your simplicity drive, or do you have other reasons to continue holding them?
LikeLike
Thanks for the question. Having double checked in fact the income figures here do not include any commercial property income (I do have some but only within the Ltd company).
You are right that I wouldn’t invest in either BTL or commercial property starting from scratch.
However given that I do have them, the Q is why do I keep them.
The BTL is low hassle and lightly levered, so I do make a small net yield. I will sell it once the current tenant leaves.
Commercial property has been a steady earner. It is relatively light intensity though not zero. Currently the economics suck but on a 20 year basis they have been OK – see a historic blog post about it: https://firevlondon.com/2023/02/26/my-20-year-property-returns/
I have other partners in the commercial property vehicle so it isn’t just my decision.
LikeLike
I couldnt see your Bitcoin allocation there?
LikeLike
In fact you could – there is zero crypto allocation
LikeLike
I fully agree with the reduced complexity – particularly useful if the manager (i.e. you) gets run over by a bus.. simplifying for our loved ones I think is pretty helpful to do. anything that has less than 2% allocation I would query it’s usefulness – even a 50% return would only generate 1% on your total..
On a tax note – I think from memory you had an Aus passport.. you could invest through an Australian pension. which would be 15% tax rate until you are 60, and then 0% from then.
Ok it’s taxable in the UK when you take it (like normal UK pension), but if you were non-resident in UK it would not be (and if in Australia it would be tax free)
LikeLiked by 1 person
I was curious about the “In practice, as example after example over the years has shown, it pays to be careful.” reference when addressing provider risk. Personally never got worried about Vanguard or Blackrock (and am much more concentrated at that level than you). Which historical cases were you thinking about / consider relevant “lessons learned”? Thank you for another great year of regular posts.
LikeLike
Hi BigEnd
The best example I can cite is MF Global back in 2011/12. It dipped its hand in the client money till. Only a bit, thankfully – clients ended up getting over $0.99c in the $1.00 back again if I remember rightly, but it took many months. I was one of those clients so it taught me a lesson.
The problem with segregation of accounts is that it relies on honesty and regulatory compliance. And as MF Global showed, even a bit of dishonesty is akin to a single solitary poo in a swimming pool – it still results in general pandemonium and disruption.
As recently as September there was the closure/breach at WealthTek. It looks like clients will get their money (up to FSCS max at least) but only after unexpected delays/admin.
I think the ‘illiquidity mismatch’ examples count here too – e.g. the Schroders/Woodford fund, the various property funds that have had to gate outflows, etc.
Another potential example, is how I don’t get a straight answer out of my private bank when I ask how segregation works with my execution only portfolios, so I assume the worst.
Widening the net somewhat would get you to Maxwell and those poor pensioners’ assets.
All in all I think the principle of segregated client funds is watertight, but the practice is leaky.
LikeLike