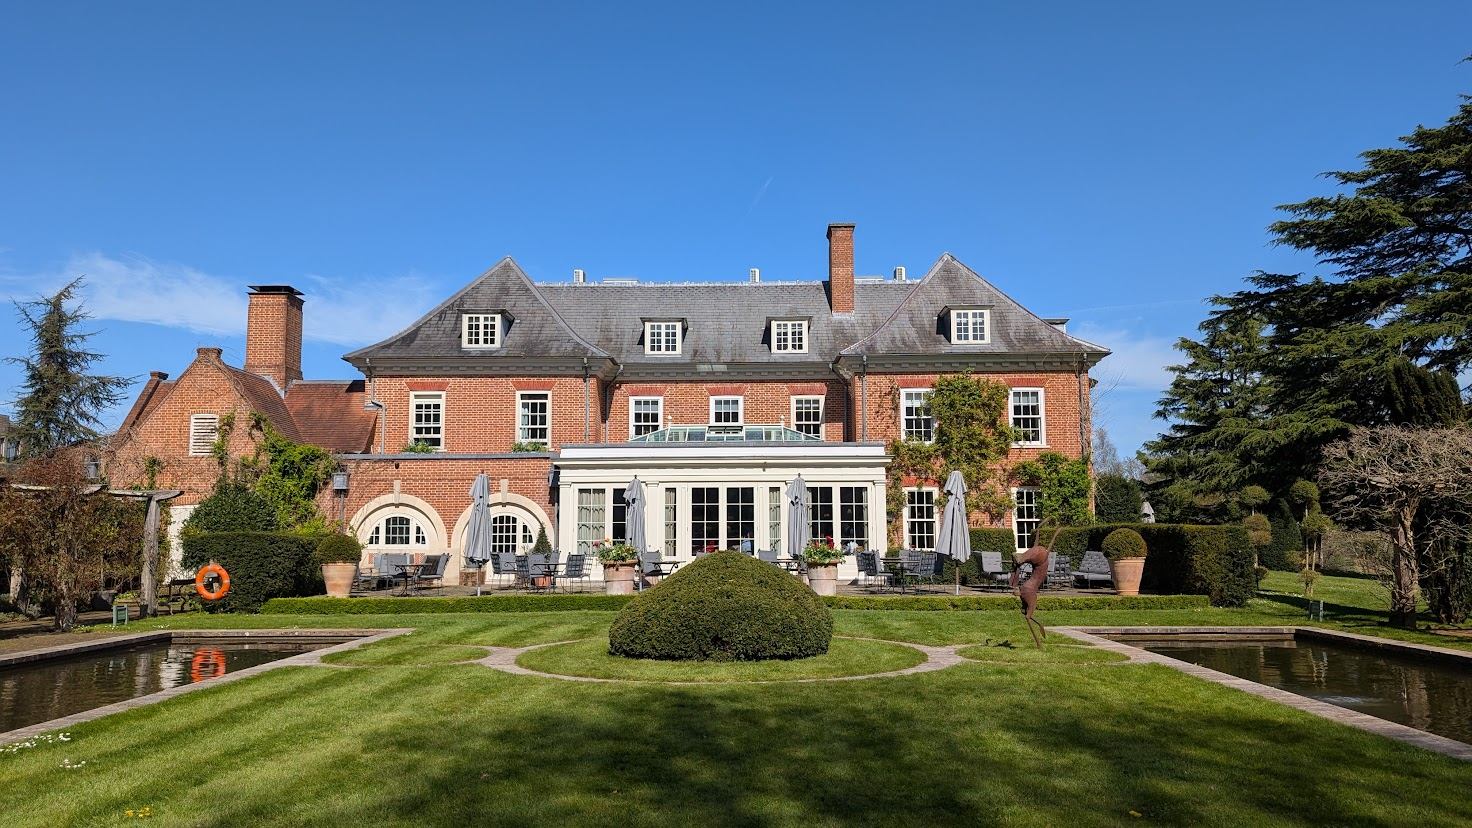
It’s been a beautiful month. I’ve been about a bit, taking in Lincoln, the New Forest, and Oxford as well as enjoying London town itself.


Financial independence, but in pricey London
It’s been a beautiful month. I’ve been about a bit, taking in Lincoln, the New Forest, and Oxford as well as enjoying London town itself.
In March the rain stopped. We started March with North London already having seen 2x its usual rainfall for this point in the year. And thankfully in the middle of March, it stopped. As I write this I have actually needed to start watering the garden, something that felt a very remote prospect a month ago.
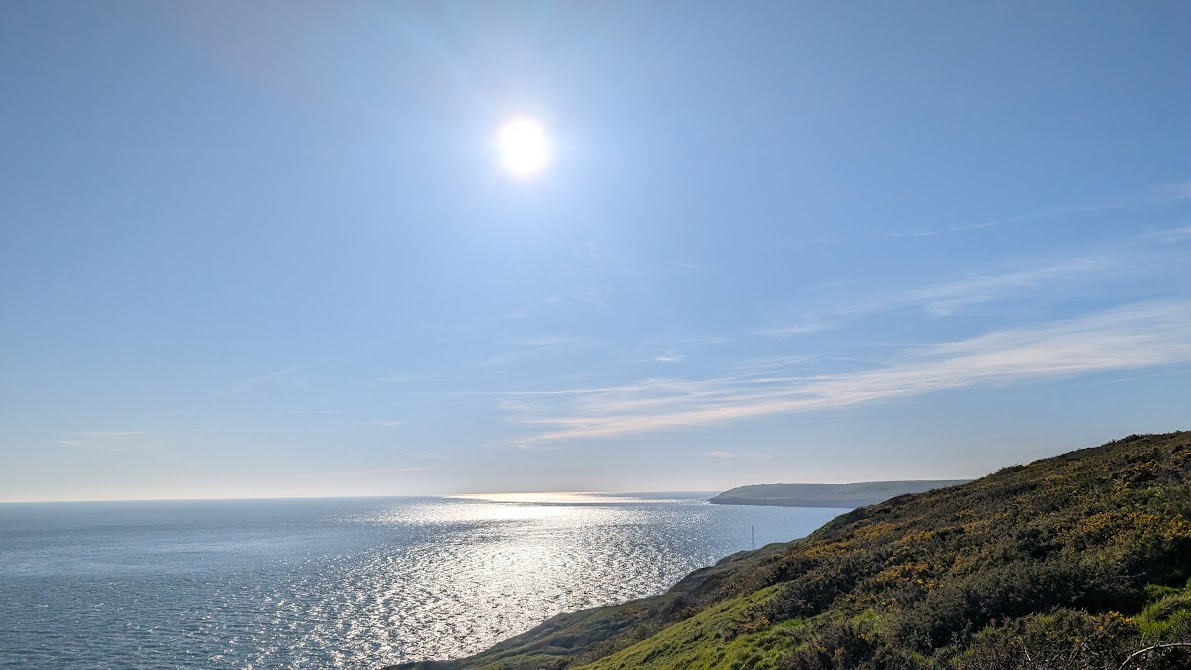
I’ve had quite a bit of travel in March. Some travel to the south coast. And some travel to the Alps.

Meanwhile out in the wider world, the US and Israel have been hard at Iran. I’m not going to comment on this madness except for what it’s done to the markets.
The market most impacted by the Iran war is the energy market. Diesel prices are up sharply; jet fuel is in short supply, and regular unleader is up significantly too. Americans, with lightly taxed fuel, are seeing a sharper increase (there is some justice in the world). Here in the UK unleaded has gone from c.£1.37/ltr to £1.57/ltr; this is a spike but not the end of days.
Continue reading “Mar ’26: Iran clobbers markets”So, for the avoidance of doubt, the end of the month is the last trading day of the month. Which for February, meant Friday February 27th.
The fact that the Israelis and the Americans invaded Iran on February 28th is going to impact March, not February.
Which is just as well because I had quite a lot of activity in February.
While the weather in the UK was pretty unremittingly miserable, I found myself rearranging quite a few of the portfolio’s deckchairs.
One of my longstanding and most thoughtful readers made a comment on my blog recently that resonated with me. @Grasmi is a Brit who has emigrated abroad – to Australia, so far as I can gather. He is a bit further ahead of me on the path to portfolio enlightenment, and here is what he said:
I vastly simplified my portfolio years ago. I’m down to 8 positions now (7 ETF’s and BRK – so basically 8 ETFs). Never looked back. Less levers to pull = less stress and “busy work”.
After doing the cleanup a long time back, over time you basically “can’t” fiddle any more due to CGT… which is a lot of ways is quite freeing. There’s always a temptation to do something, but once you’ve got large accumulated CG’s in a simple portfolio, that urge goes away. Any change you make needs to make back the cost of any CGT bill (for me this is 20-30%+) just to break even, so I’m very reluctant to make any changes.
Longtime readers will know I went through a concert effort at simplification back in 2020. What I’m left with is about 90 unique holdings held across 9 brokers (6, really; 3 of them are offshore bonds/equivalent that I barely touch and don’t need to file tax reporting on). As at the end of 2025, only 64 of these holdings were in unsheltered accounts – i.e. accounts that need tax filing.
Continue reading “Feb ’26: Before Iran”