It seems reasonable to think that this is the worst market crash in history. Stock markets are a relatively well-documented phenomenon since their invention only a couple of dozen generations ago, and the data seem clear.
And I was there.
I’ve been actively following this crash every day the markets traded. And I’ve been trading too. Ouch. This post is deliberately something of an ermine-esque ‘reflections from the front’, recording some of my thinking/recollections, as they occur to me and while they are fresh.
Wasn’t January a long time ago?
I remember reading about the Coronavirus in January. I was travelling through Hong Kong myself that month. The virus hadn’t reached HK; it was a story in the business pages about China.
From a blogging point of view I am doing my best to maintain, to some extent, my trading diary. For anybody curious about my world at the moment, the www.firevlondon.com/diary is the best insight I can give you, for now.
I am about a week late writing this monthly update, and my what a week it’s been.
February was when the coronavirus (now called covid-19) began to impact the markets. My diary called it the ‘corona correction’. At the time of writing, on the 10th March, the February story already seems rather old, but here it goes in extreme brevity.
Beginning of February. I sold my house, pocketing over £1m cash.
Middle of February: I ‘slowly’ dripfed £1m cash into the market, matching my target allocation.
End of February: the market fell almost 10%. Doh.
(early March – my house money has all gone…. but that’s getting ahead of myself!)
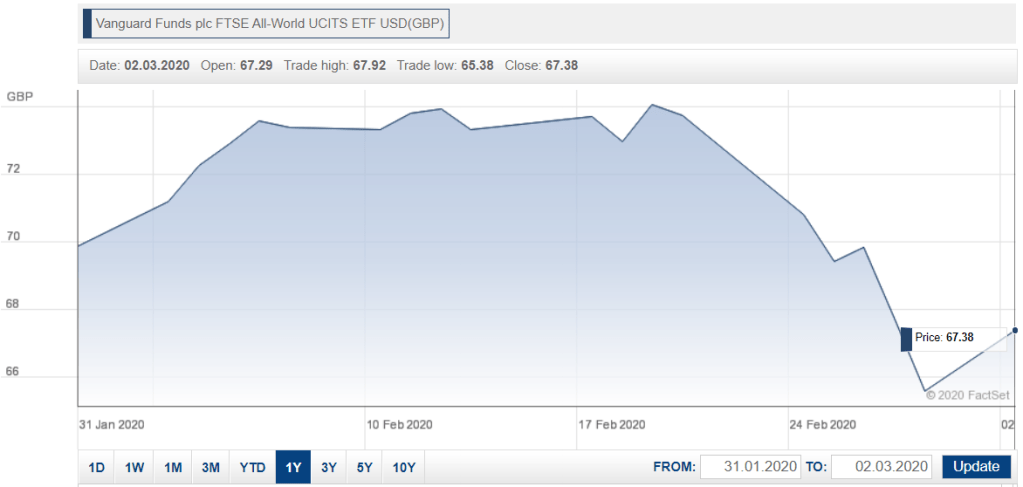
More specifically, equities fell 6-9% on the month (and significantly more off the mid-month peaks). Bonds ticked upwards very slightly. And the pound fell slightly versus other major currencies.
Feb 2020 market & currency movements
The markets, weighted to my allocation, fell 5.8%. My (very slightly leveraged) portfolio fell 6.4%, even more than the market – reflecting me topping it up by >£1m mid month, at its peaks. That high plateau you see in the graph below almost exactly mirrors the time period over which I put my money to work. Sigh.
World equity markets – daily movements in February
The other thing February was notable for was my efforts to reduce my (taxable) complexity. I sold a number of holdings, in unsheltered accounts, replacing them with fewer, larger, mostly ETF holdings. And in my sheltered accounts (pension & ISAs), I sold a bunch of ETFs and bought individual securities – concentrating my active holdings in the (undisclosable) tax sheltered accounts, and reducing my number of (disclosable) tax holdings significantly.
My efforts fighting complexity were more successful, more quickly, than I would have first thought. I have reduced my total holdings to <150. My unwrapped (disclosable) holdings are almost below 100 – a reduction of 37 since the start of the year. And my number of small (<£20k) holdings has dropped to 35 (though the market’s falls are making this target harder to hit!).
Progress towards Q1 complexity targets
My portfolio is still complex (certainly too much so for @mathmo – see comment below), but progress is being made – and quickly.
I liked FireVLondon’s revelation on the road to Shipley Tax Office that complexity was a real cost like fees and taxes. I myself just a few weeks ago pinged my tax return off with just 10 lines of information to my accountant so his inventory of tax filing effort was eye-opening. I’d suggest the solution didn’t go nearly far enough in the face of active naughtiness — if the cost of complexity were properly measured, the knife would have cut much deeper.
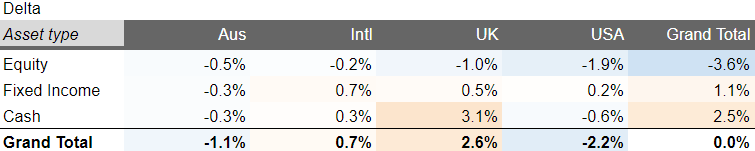
At the end of February, I was almost 4% underweight equities, around 1% overweight in bonds, and 2.5% overweight cash. With hindsight, not terrible positioning for the March roller corona-ster.
Deltas from target allocation, as at 29 February 2020