A recent blog post /comment thread on Ermine’s Simple Living in Somerset was the inspiration for this post – about the tools/processes I use for tracking my finances.
Ermine and I find ourselves relying on a 2004 piece of Windows software, Quicken 2004, produced by a US company that pulled out of the UK market for personal finance software in 2005. It continues to offer QuickBooks, for business accounts, but thankfully Quicken 2004 still works, albeit without any live-off-internet functionality. Credit due to Microsoft for the backwards compatibility too (you listening, Apple?).
Much as I had assumed that I was in a minority of about one, until I read Ermine’s blog post, a lot of online banking/credit card systems do offer some support for Quicken file formats so I suspect there are a few tens of thousands of us still out there.
But in recent years a wealth of new tools/capabilities have emerged, and as a result my approach has evolved somewhat.
These days I use a mixture of
1) Quicken (2004)
2) Excel
3) Google Sheets
4) Interactive Brokers
1) QUICKEN
Quicken is my source of truth for spending – credit cards, current accounts, etc.
Until a year or so ago I categorised every transaction. These days the advent of contactless payments has meant a proliferation of tiny transactions on my statement and I only categorise large payments or transactions in certain categories – e.g. charity donations – tho I do still categorise 90%+ of my spending.
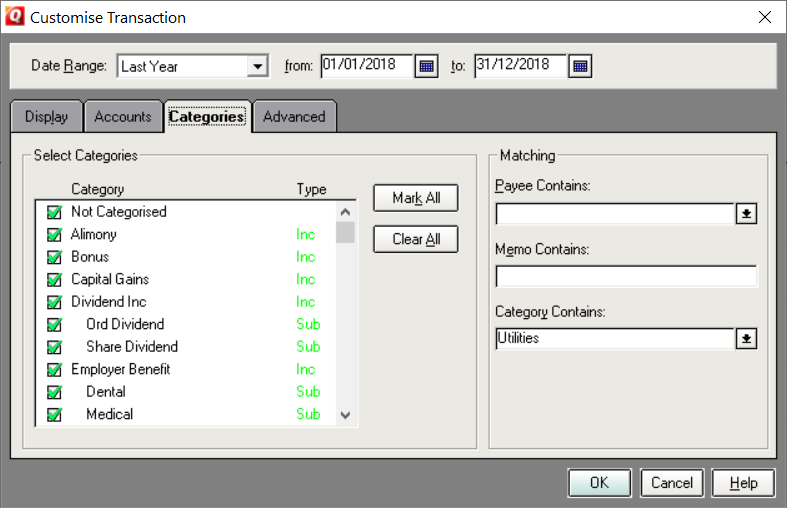
Quicken is very helpful for letting me pull out specific spending categories – e.g. charity donations, property rental spending, bank interest, previous tax payments, etc. Thankfully, many banks/card providers do let me export either in native Quicken format (despite Quicken having left the market 10+ years ago!) and/or a CSV format, and I use csvconverter.biz to map CSV files into Quicken format. As a result, manual keying, while not unheard of, is mostly eliminated.
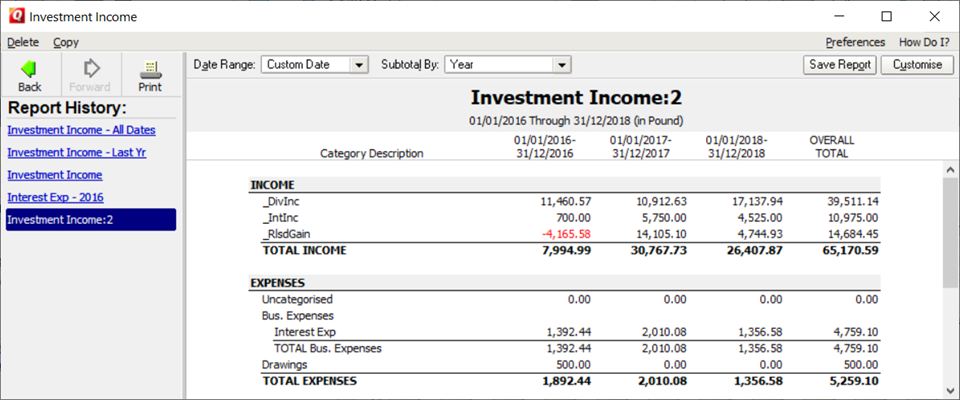
Quicken also has a record of every transaction in all my investment accounts except for Interactive Brokers. However because it won’t import prices at all (any more) let alone live ones, I don’t properly update valuations. What matters, and what I use Quicken as source of truth for, is the Buy/Sell transactions. I use Quicken for my CGT reporting for these accounts.

I also try to capture all dividend/income (except IB) in Quicken. This is a key metric I track on my FIRE journey. Quicken lets me look at it by account, by time period, by category, and export quickly in Excel. It is fast and effective, once the data is in place.
2) Excel
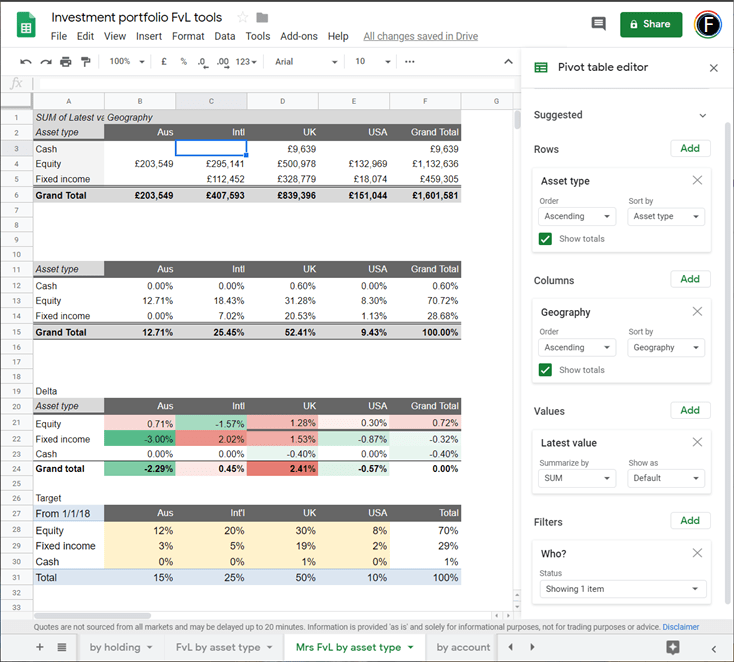
I use Excel for tracking the value of my investment portfolio, and update it fully at least monthly. It knows my target asset allocation and helps me monitor the deltas between target and actual, consolidating positions across accounts. A version of this spreadsheet is available via my blog (or search ‘FvL investment tracking spreadsheet’), in Google Sheets.
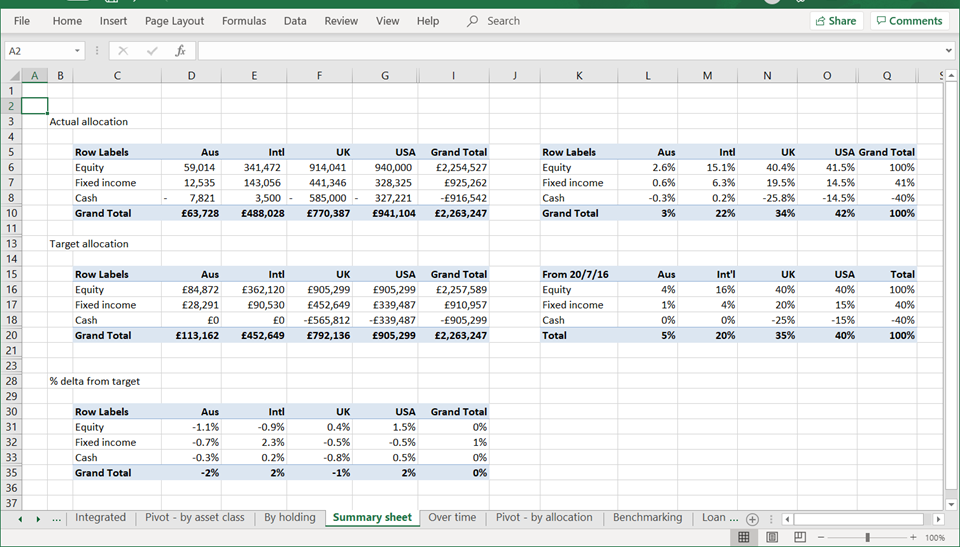
I also use this sheet to track my investment expenses – both at an account level (e.g. platform monthly fees) and at a fund/ETF level (with my estimate of TERs/OCFs).

This tracking sheet knows relatively little about my income. It does know the notional income yield of each holding but doesn’t know what actually happens.
I use separate ad hoc Excel spreadsheets for help with tax reporting, e.g. of property rental income/expenses (exporting spending from Quicken).
3) GoogleSheets
I have the ‘live valuation’ bit of my Excel spreadsheet in GoogleSheets. This is really just a vanity tool – to let me eyeball quickly, mid-month, what is going on.
4) InteractiveBrokers
My most important investment account provider is IB. I don’t keep a parallel log of these transactions, but rely on IB’s reporting tools to be able to find a) dividends/income b) year end statements c) Capital Gains. IB has excellent off-the-shelf reports, which will operate to any date range (max 12 months), as well as a build-your-own-report feature called FlexReports (that I don’t use, but like to know I could).
A product wishlist….
With the advent (in the UK) of OpenBanking, the process of integrating financial data from disparate sources is becoming easier. But it it is some way off a point that would really help me here.
In the meantime there is no shortage of apps/projects that claim to provide the perfect financial tracking solution. As yet none can yet cater for me.
Just in case one of the Product planners at Moneydashboard, ReboApp or so on is interested, here is what I want out of a tool:
- Ability to import all regular bank accounts – card statements, current accounts, categorise spending, and do reports/queries quickly (by date range and with ‘pivot table’ filtering/organising, or CSV output).
- Ability to import investment portfolios – and allow me flexibly to track security prices, dividends and compare to each other, indices, in different currencies, etc. Ability to categorise holdings against arbitrary asset types, geographies, investment styles (i.e. tag things with an arbitrary number of properties), and build custom reporting around these.
- Ability to import investment transaction histories – including dividends.
- High level of security and no funny business about data ownership. I am not as paranoid about cloud-based data as the Ermine, but I do need to trust the solution in the same way I trust Google/Microsoft/Apple/similar.
The above list really doesn’t sound that complicated to build, but nobody has done it for UK investors as of the time of writing! I would pay perhaps £100 per year for this solution but anything like £20/month sounds too pricey to tempt me.
I live in hope….