
I’ve been tracking my portfolio rigorously for over four years now. One thing I’ve been asked for quite a few times is a copy of the spreadsheet I use to monitor it. So here goes.
I face three key challenges in tracking my portfolio’s returns:
- Unitising the portfolio. This means correcting for ins/outs – withdrawals or deposits. Just because a £1m portfolio gained £100k doesn’t mean it’s delivered a return of 10%; if £30k of that gain was fresh contributions, for instance.
- Evaluating the portfolio’s exposure. By exposure I mean allocation by geography and allocation by asset type (equities, bonds, etc). Some platforms let you ‘X-ray’ your holdings but each has a proprietary way of doing it, and many platforms don’t offer any such feature.
- Integrating my holdings across multiple accounts. I have accounts with several brokerages and platforms. Each has a different way of doing it. They don’t even use the same tickers for the same underlying assets. I want a way of pooling all the portfolios into one consistent spreadsheet.
My template spreadsheet is available as a Google Sheet here. It’s read only, but you can make a copy (either download a copy in Excel, or make a copy in Google Sheets) to edit yourself. All appropriate disclaimers apply – use at your own risk.
This template spreadsheet includes example tabs for about half a dozen UK brokers, including Selftrade, TD Direct, Fidelity, Interactive Investor, Cofunds and Hargreaves Lansdowne. Adding a tab for a broker not already covered is not a difficult process.
Instructions are included on the first tab of the spreadsheet. Users need to be pretty familiar with spreadsheets and how they work.
In broad terms what you need to do to update the sheet is first of all download the latest portfolio as a CSV/Excel/similar from your brokerage accounts that you want to monitor. Then copy/paste into appropriate tabs in this sheet.
 Then add any new securities that the spreadsheet hasn’t yet seen. The template is designed to map lots of different versions of the same security (e.g. common holdings like Vanguard’s FTSE-100 ETF, or Vodafone shares) onto the same underlying security.
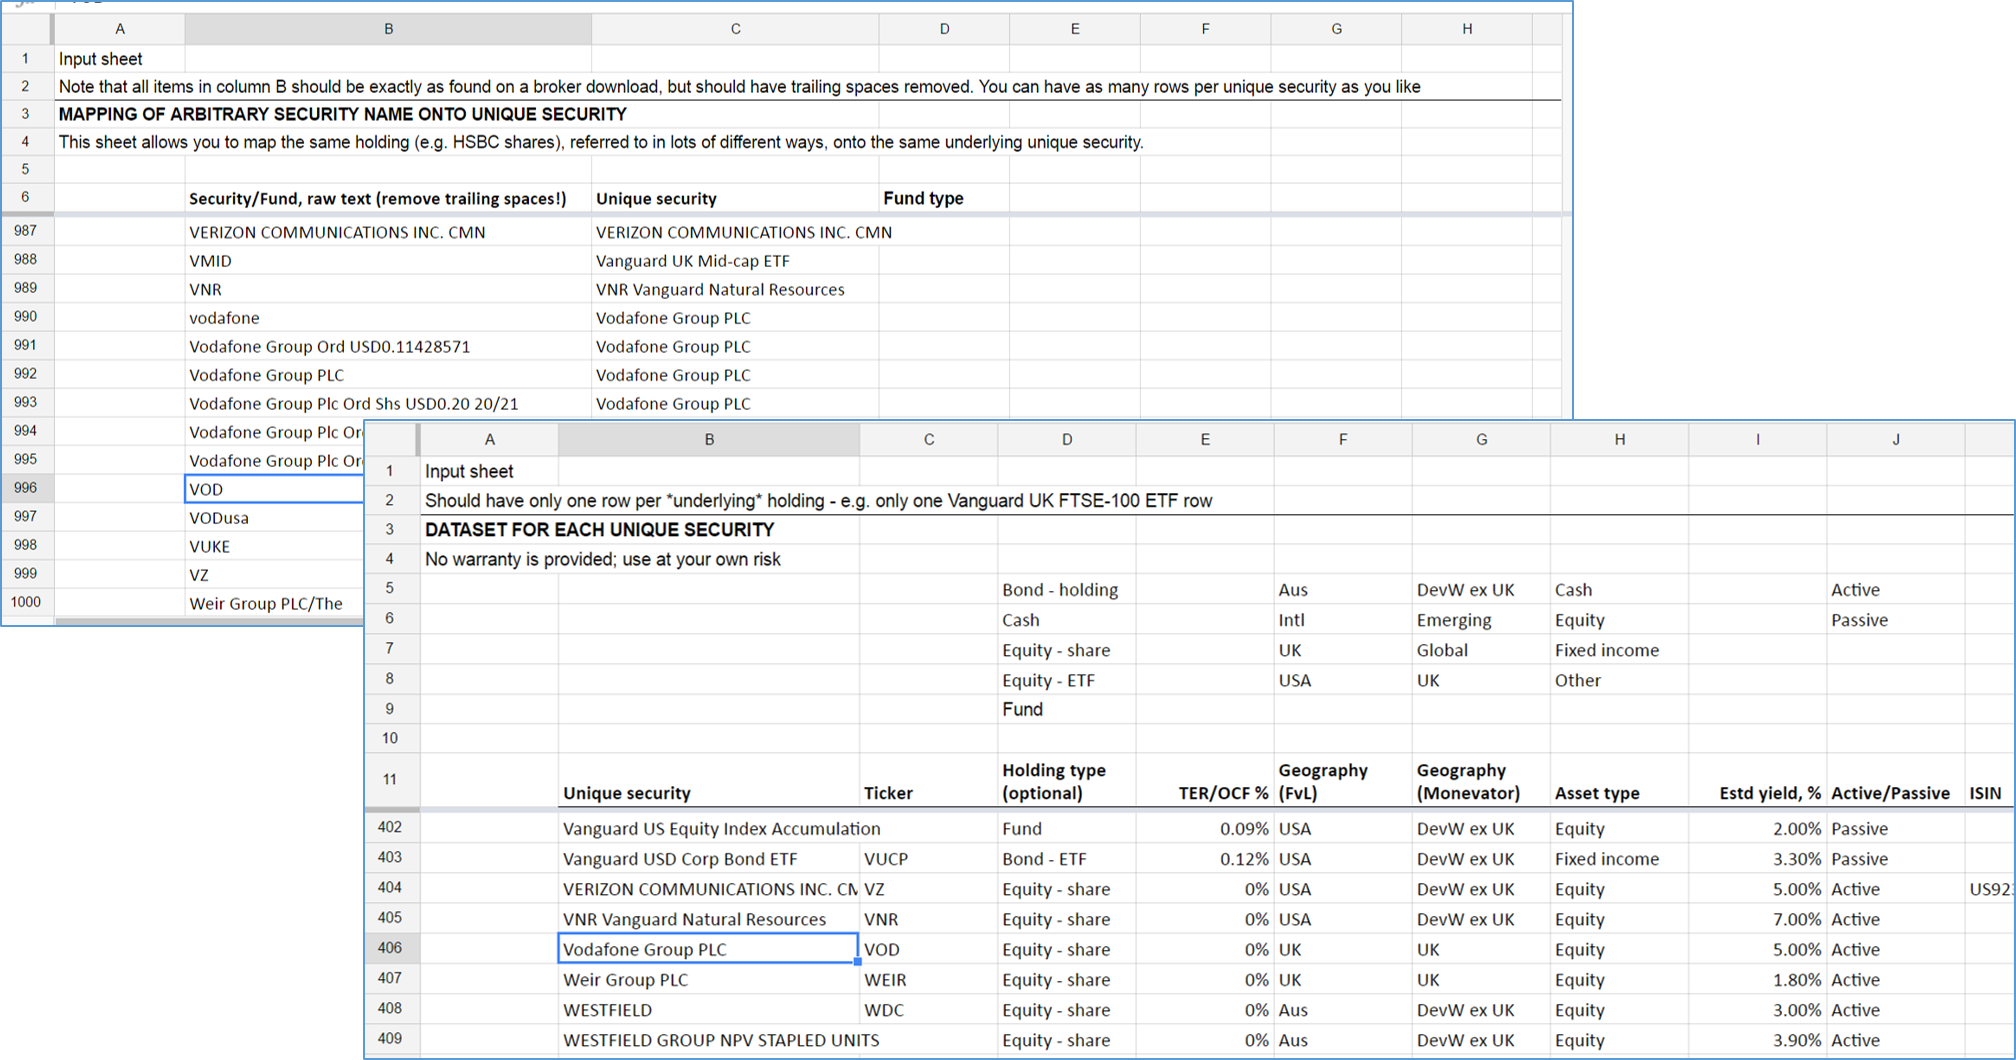
Bingo! – you have a consolidated view of your portfolio.

And you can drill into your portfolio by geography or asset type.

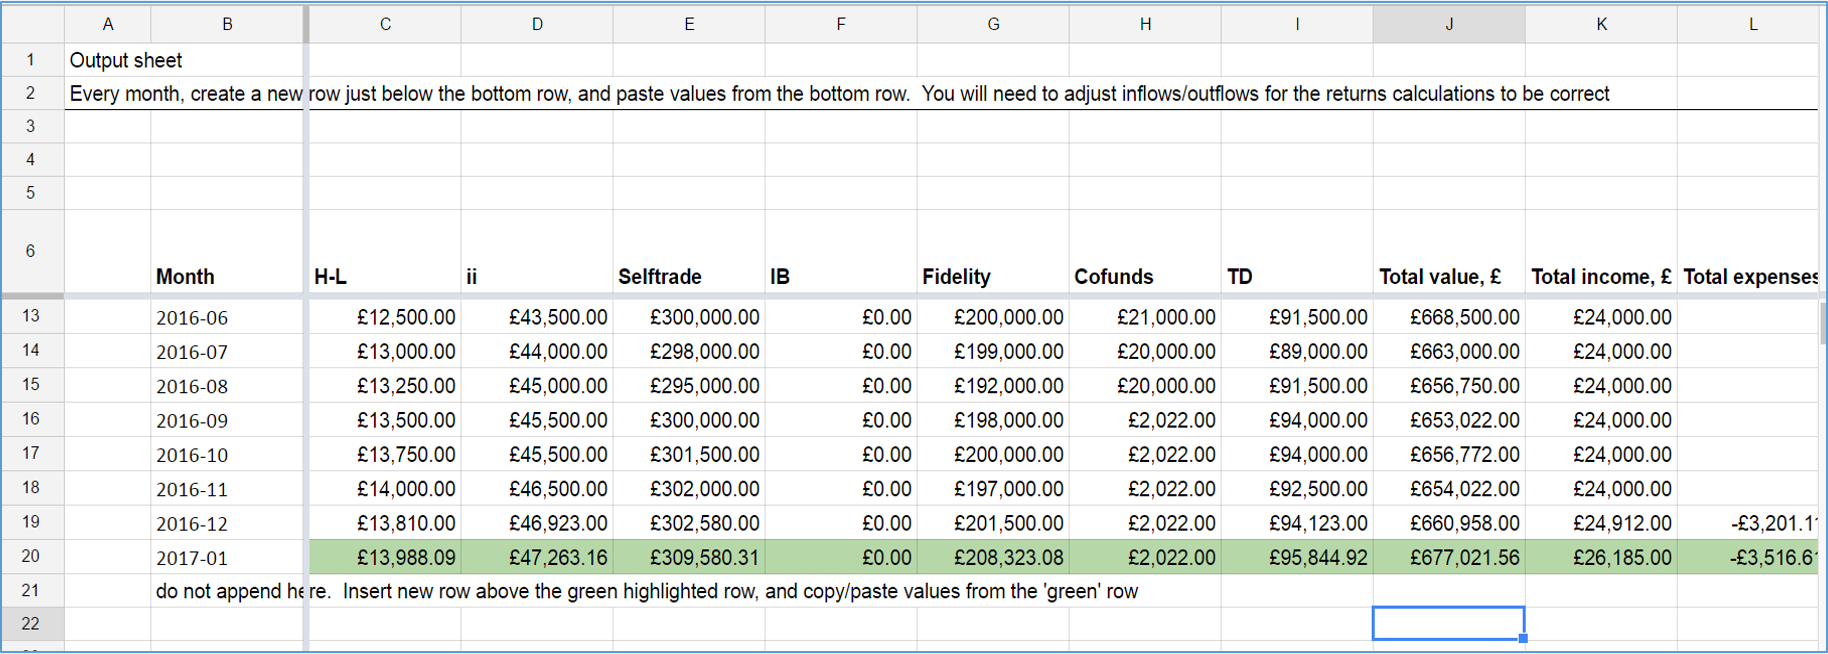
Then every month / quarter / year, you need to do two things. Firstly, copy/paste the latest values into a new row in the ‘over time’ tab.
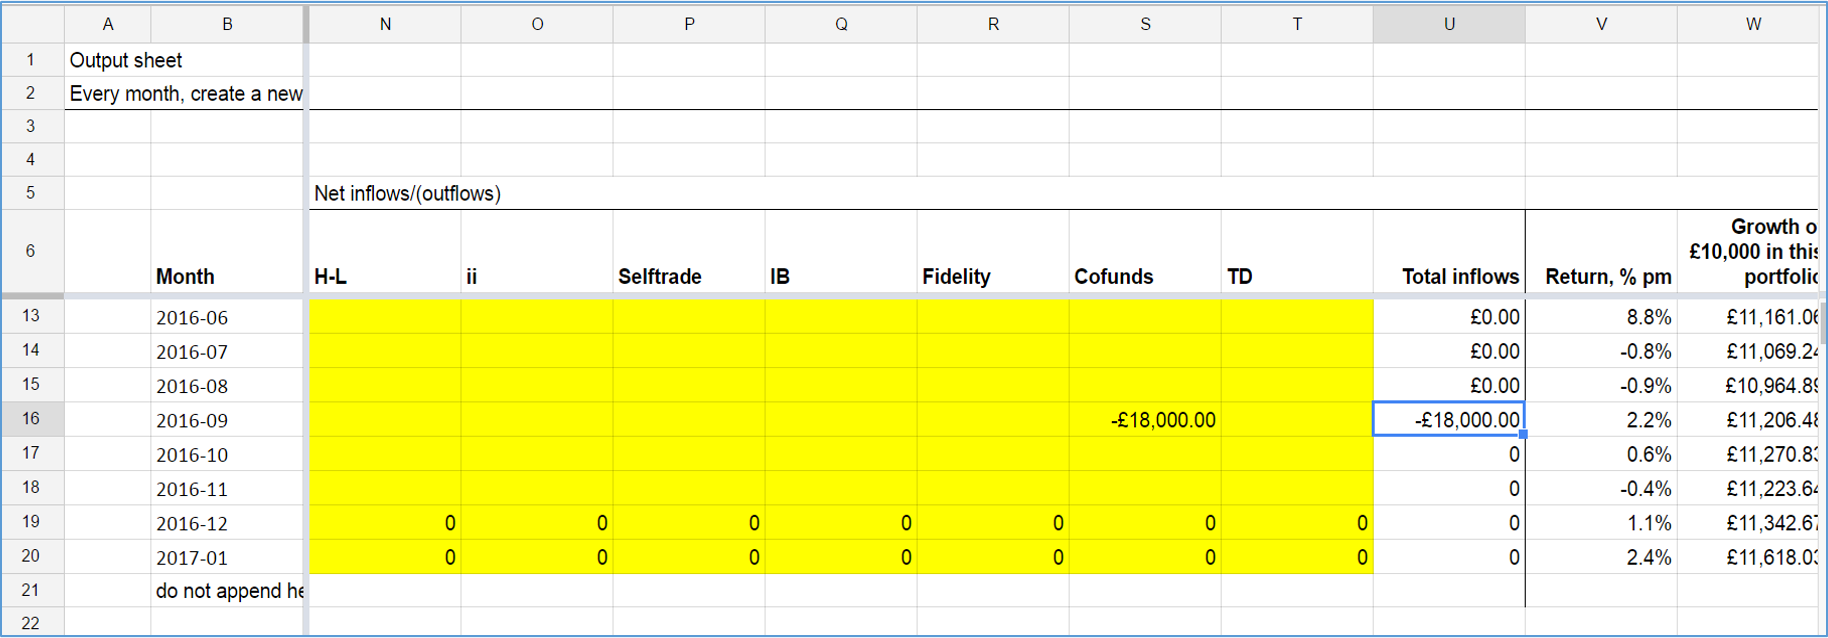
Secondly, record the deposits/withdrawals in each account.
The spreadsheet will then build up a picture of your portfolio’s performance over time.

What this monitoring spreadsheet does not do is pull in real-time valuations from Yahoo! Finance/similar. I find such processes to be error-strewn, so have left them as an exercise for the reader.
[!NOTE: Latest spreadsheet v2.0 now DOES support real-time stock price updates. See more recent blog post here!]
I’d welcome comments on how useful this template spreadsheet is. If you have trouble using it please email me on mail at firevlondon.com and I’ll do my best to help. If I sense people are actually using it I may post ‘upgrades’.
In case you’re wondering, the initial portfolio data in the spreadsheet are all sample data only. But it does include 1000+ actual mappings of actual real life securities, and reasonably-up-to-date yield/expense/etc tagging for about 500 securities; this should speed up the process of getting your portfolio into the spreadsheet. Good luck!
P.S. Thanks to @Andrew for pointing out that Google Sheets won’t export the PivotTable into Excel properly. If you want to use the PivotTable in Excel you will need to rebuild it yourself. Here’s how
- In Excel, with your repaired workbook.
- Go into the 3 Integrated tab
- Put your cursor in the main data table, e.g. on a yellow ‘END MARKER’ cell.
- Insert.Pivottable. Follow the defaults which will create a new sheet with a fresh blank pivottable.
- Then put Geography into columns, Asset type into rows, and £GBP value into the Values. Et voila. I often find it useful to put Account into Filters too.


Thanks – this looks really useful. I’ve been planning to put together an “X-Ray” sheet for almost a year now, but I’ve just been too busy / lazy.
I hope your sheet will mean that I finally get around to it in the near future.
LikeLiked by 1 person
Thanks for sharing. Always useful to see how others are tackling this. On broker selection, is there any specific reason you’re not using Interactive Brokers? On my search I found them to be the cheapest and most fully featured platform (especially for dealing with foreign currencies and equities), with the best liquidity and fills I’ve encountered from a retail platform. The reporting and data available for extracting to spreadsheets like this is also excellent. I was just curious why IB didn’t make the cut for you in terms of broker selection (in case I’m missing some obvious negative with them – I have a lot of my eggs in that basket)?
Keep up the great work.
LikeLiked by 1 person
Good question! In fact I love IB and use them a lot. They were in this spreadsheet until the last minute. However they are extra fiddly for spreadsheet updating for a few reasons. And I think they are quite niche in U.K. where they don’t support tax-sheltered ISAs.
LikeLiked by 1 person
Ah ok – great – I’m not going crazy then – I thought maybe I was missing something! I’m currently based in Switzerland so the ISA situation is not such a big negative for me (although I quit my job yesterday, and depending on how successful they are at reeling me back in I could end up in either Singapore or back in London – if the latter, the ISA situation will become more of a consideration for me).
I really find IB the best retail brokerage out there, and have most of my liquid assets in there. My only real gripe is that being based in Switzerland they made me open an account with the UK subsidiary and not the US one. Why does this matter? Because the US accounts are covered by SIPC (500k USD) as opposed to FSCS (50k GBP – i.e. Great British Pesos lately!).
I have “Flex Queries” set up in my IB account automatically emailed as CSV to my gmail, then an IFTTT job downloads them to my dropbox automatically. I have a monster spreadsheet which covers my wider situation (the lights in the house flicker when I open it!) with some macros to import the data from the Flex Queries CSV files. It’s nice as I just hit one button to suck all the trading / portfolio data in. I have 4 main data sets I work with from IB:
– Cash Transactions (dividends, also includes deposits and withdrawals to correctly calculate the real portfolio returns net of deposits / withdrawals)
– Positions (just for managing current positions, but I also snapshot this data on a monthly basis for historical analysis)
– Trades (I mainly use this for managing my options trades, but also historical trade/pnl analysis)
– NAV (daily view of net asset value used for return calculations)
The concentration risk with IB is a fairly major concern for me, but at the same time, it is really nice to be able to manage everything on the one platform, and for the moment I have chosen simplicity over risk reduction. This dramatically simplifies reporting and general day to day management. Being able to convert and move money around the globe at spot for $2 is a nice bonus. If I successfully leave my job I will need to diversify across more brokers as A) I will be more dependent on my investment income, and B) will have a significant cash injection (forced equity sale from my current employer) which I intend to invest in equities, but placing that with IB too leaves me severely exposed to them as a counterparty.
It looks like you’re fairly diversified across brokers (assuming you have accounts for each of the tabs in the sheet)? Do you have a set of rules or guidelines you use to diversify across brokers? The thought of having to log into 10 different accounts fills me with dread – I’m hoping to maybe settle on 2 or 3, the selection of which will be dependent on which country I end up in next.
Cheers,
Graeme
LikeLiked by 1 person
Thanks @GraSmi – this is enomously interesting and useful. I too am with the UK/Swiss bit of IB. I do have a Flex Query set up but haven’t got anywhere near emailing/IFTTT/macros off it, ordinary mortals take note!
As to diversification… I have indeed used all of these brokers/platforms at some point in the last 4 years. However I don’t still use them all. As astute readers of my blog will know I also use some others, ahem. Why so many? My original thinking was partly diversification and partly self-education. In truth the diversification has always been mostly a figleaf but the self-education has been helpful. Latest thinking on each one is as follows:
– H-L: Why opened? For professional interest. And despite my reservations – I am cynical about their high fees and poor value. Why keep it? Generally H-L is redundant without a clear USP vs e.g. Fidelity/ii. But it would be a good starting point for service-led (i.e. non-blog-reading) people e.g. many friends of mine.
– ii: why opened? For an execution-only passively managed SIPP. I think it’s arguably the best pick for larger execution-only accounts. Why keep it? It maintains its edge.
– Selftrade. Why open it? It bought another exec-only broker that I had picked >15 years ago for its low fees. It’d become my main execution-only platform until I discovered IB. Why keep it? Diversification. It has a material slice of my portfolio.
– IB. Why open it? Lowest fees, most powerful platform, provided you don’t need ISAs. Why keep it? Best-in-class platform for fees/features/markets. And not only does it offer margin loans – but they are very competitively priced. As a result it now has a big part of my portfolio.
– Fidelity. Why open it? Originally it was a trusted full-feature brand that I knew professionally and respected. I wanted to learn how good it was. Why keep it? It’s been OK – it earns its fees. High service levels, good range of products. I recommend it to service-led folks like my family.
– Cofunds. Why open it? pre-RDR I moved some old (Jupiter et al.) funds into a fees-rebated-to-me IFA and they offered Fidelity or Cofunds. I chose Cofunds because I already had Fidelity. Why keep it? Post RDR, I haven’t.
– TD. Why open it? For Oz trading. Why keep it? Post IB, I haven’t.
Good luck with the country choice! And thanks for helping my blog.
LikeLiked by 1 person
IB do actually have data API’s so you can pull data direct to Excel (it’s a 2 step process however – you need to call the API to get a token, then you call again to get the data). It’s fairly easy to set up, but I went with the flex query via email approach for a few reasons –
1) I have an historical copy of the data off their systems which I know can’t be tampered with
2) With IFTTT it’s all automatically put in my dropbox, so no real overhead after setting it up
3) If I’m travelling light and only have my ipad with me, I can still open the CSV data via dropbox and manually copy the data into my spreadsheets (bypassing the macros that I normally use to import the data on my desktop).
Thanks for sharing your reasoning on the other brokers! Very useful. If I manage to escape the clutches of work (it’s just a question of how big the carrots are they try and block the doorway with) I will need to pick a few more to spread my risk, so this is very helpful. Thank you for sharing.
Graeme
LikeLiked by 1 person
I just decided to get serious with my own portfolio management/tracking and came across this post. I wish I had seen it before I spent hours building a spreadsheet of my own for all my accounts, but this seems much better so I will probably use it to rebuild mine from scratch (treating the old effort as sunk cost).
Regarding brokers, have you considered x-o.co.uk? For execution only passive SIPP/ISA they can’t be beaten on costs I think (no admin fees and dealing costs of 6 quid per trade).
@Graeme:
Regarding IB, you still benefit from the $500k asset protection. The location of the account doesn’t matter as the assets are held by the US subsidiary. This is mentioned in one of the agreements that we signed when we opened the account and we never read 🙂 I have asked them about it and was confirmed in a chat. Do the same if you want some peace of mind!
LikeLiked by 2 people
@greektaxpayer thanks for your comment! I have come across x-o but a bit late in the day. They would be a credible alternative to Selftrade but the savings don’t quite justify the switch. Selftrade is £10 for etfs and £12 for stocks. I do perhaps thirty trades a year, so the saving would be at most £150 p.a. This is less than one bip and so not worth the hassle. But if I was starting again I’d use x-o instead of Selftrade.
LikeLike
@greektaxpayer – Thanks a lot for the information – that’s excellent news! I had previously contacted support and they had told me (it was a few years ago now) the account was only covered by the FSCS. I raised a ticket tonight however and they confirmed that the account is covered by SIPC. Perhaps it’s the usual support situation where you keep asking until you get the answer you want (in fairness to IB though – I do generally find them fairly consistent and reliable on that front). That is a great relief, and at least lays off some of the counterparty risk I’m running with IB.
Let’s just hope we never actually have to try and claim from it… 🙂
LikeLiked by 1 person
Just a quick note – I double checked with support, asking to confirm SIPC coverage, even for UK accounts specifically (just in case the previous response had been a cookie cutter job they normally send to US clients – it wasn’t specific), and they did. In case it’s useful for others:
Your Account is under IB-UK, but as the custodian is done by IB LLC for all products except metals and OTC CFDs your account is protected by the SIPC.
You find further information on the link below:
http://ibkb.interactivebrokers.com/article/2012
Thanks again @greektaxpayer.
LikeLiked by 1 person
Thanks for sharing. I use similar sheets and I will take a look to see if I can find something new and interesting that I can incorporate.
Was surprised to see TD as a prominent UK broker. As a TD shareholder, this pleases me 🙂 Is TD big in UK?
Best wishes
R2R
LikeLiked by 1 person
Very belatedly noticed that I haven’t replied to your question – sorry! TD has now merged with Interactive Investors (not IB, note), and the combined platform is one of the top 5 now in the UK. It has consolidated onto the TD tech platform, which has pluses and minuses.
LikeLike
Very nice. I use ShareScope for portfolio tracking but a well designed spreadsheet is always going to be more flexible. I’m sure a lot of investors will find your spreadsheet very useful, so thanks for making it public.
LikeLiked by 1 person
Thanks for the spreadsheet. I use SharePad but it doesn’t take into account investments and withdrawals in it’s % calculations. So was planning on using the bogleheads spreadsheet you have previously mentioned. But this is even better.
LikeLiked by 1 person
Thanks SCS. I should have mentioned that this spreadsheet uses essentially the same methodology as the Bogleheads spreadsheet. Combined with my very own aggregation / allocation analysis functionality.
LikeLike
Hi FvL,
Thanks for this – very useful, and with all the comments as I will be looking to choose a new execution only broker for the next tax year – seems I have a lot of evaluating to do!
FiL
LikeLiked by 1 person
[…] An investment tracking spreadsheet for you to try – Fire V London […]
LikeLiked by 1 person
Hi FvL,
Thank you for sharing. Just beginning to have a play with it…unfortunately when I try and open it in excel (after downloading it) I get a ‘We found a problem…’ message. This effectively removes the pivot table from the pivot table tab i..e this tab is blank.
Do you know if there is a way around this at all?
Thanks again.
LikeLike
Erm which version of Excel are you using, on which OS?
LikeLike
I am on Windows 7, with excel 2016.
After saying ‘yes’ to do you want us to recover as much as possible / trust the source (if say ‘no’, then file does not open) then this is the message:
Removed Feature: PivotTable report from /xl/pivotTables/pivotTable1.xml part (PivotTable view)
Removed Records: Workbook properties from /xl/workbook.xml part (Workbook)
LikeLike
Andrew – yes I see what you mean. The same happens on my PC. I blame Google Sheets’ export faciity.
I suggest you rebuild the pivot table in Excel. I’ll append instructions on how to do this in this post.
Sorry for the inconvenience!
LikeLike
Hi
That would be great (re pivot table instructions) if you could – thanks a lot.
LikeLike
I use Halifax, TD & AJ Bell in the UK.
Halifax were the original.
I added TD for an increased range of overseas stocks, but they blew that business by increasing the spread on forex comission to 2%. Now back to 1.5% I believe, but even 0.5% would be greedy !! Also, if I hold USD 10,000 in forex, they will not allow me to spend more than about 90% of it in one trade because of the risk of forex movements. Even if I have several hundred thousand with them.
A J Bell are for my SIPP.
Anyway, are there any brokers out there that would easily allow me to open an offshore broker account ? e.g. In Singapore.
This is not for tax dodging, rather to have something beyond our borders to assist my swift emigration the next time we look like having a Labour government.
LikeLiked by 1 person
Hi FIRE v London
This spreadsheet has been the best gift I’ve received from finances blogs or forums. It’s really powerful and easy to use.
Thank you for sharing with the digital community.
LikeLiked by 1 person
Thank you for the feedback! Please spread the word. And let me know if I can improve it.
LikeLike
[…] in my ranch, I finally made the jump in moving my main portfolio tracking spreadsheet over from Microsoft Excel to Google Sheets. This is not a painless process but certainly makes […]
LikeLike
This looks really interesting. I have funds mostly with AJBell (SIPP, ISA, dealing), with another smaller chunk in Nutmeg (pension, ISA), and then some savings accounts. I created a very clunky Excel for everything a couple of years ago, but it’s totally amateurish, and have been looking for something better. I’m assuming adding AJBell would be relatively painless…
LikeLiked by 1 person
Yes it would be simple. If you want to post a downloaded ajbell statement to mail at firevlondon.com I will do it for you.
LikeLike
[…] track all my investment portfolio holdings in one single investment spreadsheet. One advantage of this approach is that I have a consolidated view of my portfolio which […]
LikeLike
[…] hour (bloody idiotic), busying myself building a spreadsheet to track returns and allocations. Like many others my intention is to unitise my portfolio (1, 2, 3, 4). I’ve been reading about […]
LikeLike
[…] and actual, consolidating positions across accounts. A version of this spreadsheet is available via my blog (or search ‘FvL investment tracking spreadsheet’), in Google […]
LikeLike
[…] https://firevlondon.com/2017/01/17/my-investment-tracking-spreadsheet/ […]
LikeLike
What a brilliant resource, thank you.
If it is still current I would really appreciate a few lines on how to set it up from scratch, especially the ‘4:Over time’ sheet with expenses and income
LikeLike
It is still current! Not quite sure what your question alludes to – if we are talking investment expenses and investment income, then roughly speaking just ignore them – and record the month end figure instead in the ‘over time’ spreadsheet. Only thing you need to think about is any withdrawals or contributions (including expenses paid elsewhere – e.g. ii lets me pay the monthly charge from my current account- this is effectively a ‘contribution’). If you mean your monthly spending/income in your current account, that is a different matter.
Can you clarify?
LikeLike
Thanks, I’m struggling to understand a few bits of the ‘Over time’ sheet.
What constitutes Total income in col K? is that where you would enter dividends?
On the same sheet I’m unclear as what to put in the Total Expenses column as the start figure (you have £3201.11 but not sure where you got that)
I think i’m right in assuming that the yellow shaded Net inflows/outflows is where I would record new money added or dividends withdrawn but what about dividends received?
LikeLike
So the bottom row is ‘live’ – and pulls in Income from Integrated’s column T total, and Expenses from Integrated’s column S total.
Each month you would then create another row on ‘over time’ (note that I haven’t been doing this since 2020-03 and 2023-01!) and Copy/Paste Values into that new row – thus freezing the latest state of play in aspic.
Income and Expenses in columns S/T in 3: Integrated are themselves approximations based on a % yield/fee against market values, for each security held in 3: Integrated.
On the 4: Over time sheet, I have ‘hacked’ in the same income figure for the last few 2019/2020 rows but in practice these figures would change each month with market fluctuations. For your start figure it would just depend on how you fill in your Integrated sheet – this sheet should have all your holdings from all your portfolios, and columns S and T then estimate the income and expenses for each holding.
Yellow are where you put in withdrawals/additions to the account. Any dividends received but not withdrawn you can ignore – they will slowly add to the value of the account (whether accumulating as cash or reinvested by you into other holdings). Provided you keep your 3:Integrated sheet up to date, the dividends received will be kept up to date via that – for instance if the cash balance just keeps going up every month and you keep the CASH rows updated then the 4: Over time sheet will stay up to date too and calculate your returns for you (including dividends).
LikeLike
Got it! Thank you so much
LikeLike