Leverage reaches its limits

Longstanding readers will know that I have been an avid user of leverage, ever since I used it to buy my Dream Home in January 2016. At that point I was able to borrow funds, very flexibly, secured on my portfolio. And rates were well under 2% in all major currencies.

When I started my leverage journey, I was borrowing over GBP1m, in a ratio of 3:2 GBP:USD.  The rates on both were, from memory, between 1% and 1.5%. At this point the interest is more than covered by the after-tax dividend income on the securities, leaving any capital gains or untaxed income as leveraged upside. My main concern from having debt was not the financing cost, but the leveraged exposure it left me with – a 10% drop in markets would have hit my portfolio’s value by around 15%, and potentially left me vulnerable to the bank calling in some of the debt (via ‘margin calls’).

Since January 2016, base rates have started to climb – for the first time since the Global Financial Crisis in 2008. This change was long heralded and a long time coming.

I’ve been aware of the change in rates posture, but not been paying too much attention.  After all UK base rates have risen to only 0.75%.  Euro rates haven’t changed.  But I must admit I had somewhat missed the fact that US base rates have risen above 2%.  Two per cent!  That’s becoming a proper base rate.

In the meantime, I’ve succeeded in reducing my leverage very significantly.  In debt terms, by around half.  In loan-to-value terms, by more than that – because my portfolio has grown as my debt has shrunk.

I recently reviewed the rates I’m paying for my margin loan and finally clocked that now my USD debt is costing me over 3.25%.  IB’s rates start at 3.7% and then drop to 3.2% up to $1m of loan.  This much higher interest rate has made me reconsider my target leverage.

2018 11 20 USD IB rates

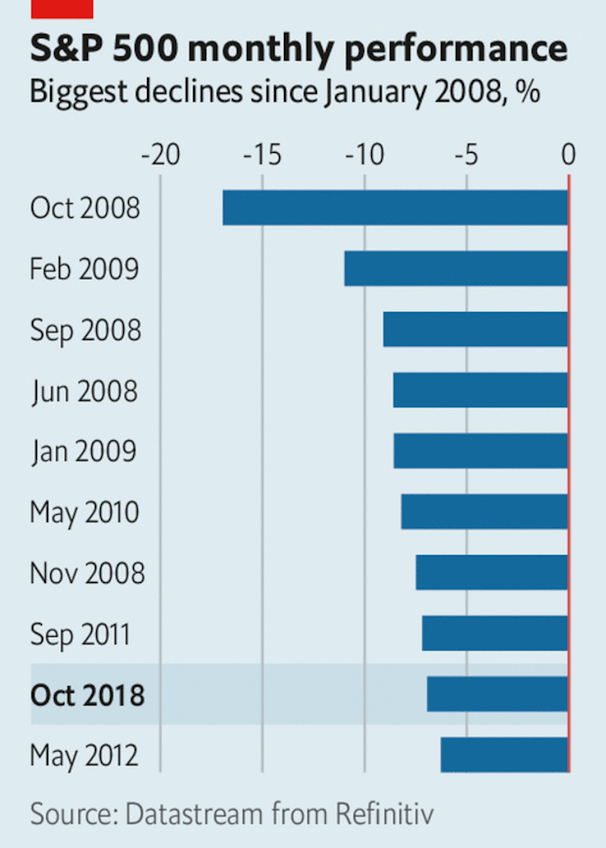
With USD rates over 3%, but my loan to value being around 15%, my main concern now is the financing cost / spread, not the level of exposure/risk.  Paying interest of over 3.25% out of after-tax income now requires yields of 6% or more, which is getting into ‘high yield’ securities only – something that I know from experience tend to deliver pretty poor total returns. Of course capital gains may yet deliver an overall gain, even after tax and interest costs, but that is much more of a gamble than I faced two years ago, especially with October’s correction still a very recent memory.

Continue reading “Leverage reaches its limits”

Ouch-tober 2018

I have to take my hat off to Theresa May for her performance in October.  Dancing (well, jiving, at least).  On stage.  To kick off her make-or-break appearance at the Tory conference.  That lady has balls.

The big news this month has been foreign.  Alien, even, in the case of another lady with balls – Jodie Whittaker (“Why are you calling me Madam?”) breaking the Doctor’s glass ceiling.

201b083131874d9b1476d9d7029f0302

We’ve had Saudi Arabia in the news for much of the month, for some gruesome reasons. We’ve had foreign governments getting a whipping in Germany or, Royal visit notwithstanding, losing their majority in Oz.  We’ve had the USA administration pulling out of a Russian nuclear arms treaty.

And of course, we’ve had the major geopolitical upheaval that is a new phone from the most important FAANG.

I suppose a quick recap of the worldwide developments would, on balance, suggest downward pressure on the markets.

I really don’t think however that Doctor Who, returning to Earth after a prolonged absence and reviewing  recent developments, would expect such a brutal, consistent month in the equity markets.  Everywhere.

October saw the biggest market drops since my monthly portfolio tracking began in January 2013.  In fact The Economist says October saw one of the top 10 biggest monthly falls in the S&P 500 since the 08/09 crisis.

2018 10 biggest monthly falls Economist
S&P 500 monthly performance; biggest declines since Jan 2008

The Sunday Times shows the worst months for FTSE since the 1960; October 18 isn’t one of the worst 10 but most of the worst ones were more than 30 years ago!

Worst months for UK stock market since 1966 (Source: Sunday Times)

What was clear, as October drew on, was that everything seemed to be falling.  Asian markets have had a tough year already, largely due to Trump trade spats.  European equities have similarly faced trade headwinds.  But now the USA, Oz etc fell sharply too. The Sunday Times has a nice graph in fact:

How FTSE compared with other global stockmarket indices in October 2018 (Source: Sunday Times)


Most noticeable for some of us was the big drop in tech stocks.  Some FAANGs had fallen 20% at points; only AAPL seemed relatively immune from the sharp change in sentiment.

2018 10 FAANG stocks

Amidst the hysteria, you’d have been hard pushed to notice that bonds were relatively unaffected by this carnage.  UK corporate bonds actually went up almost half a percent.  For once, correlations didn’t all converge.

2018 11 02 Tweet wow bonds

Currency movements deserve a brief mention too.  For UK investors October was another month of big Brexit-driven swings.  The pound rose against the USD above £1:$1.32 at one point, before falling to £1:$1.27 where it pretty much finished the month.  The dollar won the October currency battle, which took the edge off the S&P being the biggest casualty in the equity contest.

2018 10 FIRE v London market returns weights

Continue reading “Ouch-tober 2018”