
And we’re off, into 2025. Before we get too far, it’s time to take stock (pardon the pun) of 2024. I’ll follow the 7 point approach I’ve used for the last few years, starting with the wider market context.
Q1 How did markets do?
December saw falls across most asset classes – arguably reverting to the mean after the November gyrations caused by the Trump election win. The Australian dollar continued its significant fall, with the markets worried about the Trump tariff threat against China – a key export market for Australia.

Equity markets’ performance in 2024 look strikingly similar to that of 2023, with the exception of the UK – which returned almost 10% (including dividends), roughly twice its 2023 result. Equities in the USA rose almost a quarter (2023: 26%), and in other major markets rose around 10% (2023: 10% in International, 12% in Australia, exactly the same as 2024).
Bonds’ performance looks quite different to the 2023 figures. US bonds rose 1%, UK bonds dropped 4% and others were flat, whereas in 2023 Bonds rose 3-5% across all major markets.
And looking at currency movements, the pound continued to climb in 2024 against most currencies, except for the dollar – where its initial climb ended up as a modest fall, with USD up 1.8% against the GBP. The pound now buys over 2 AUD, a striking change from 2 years ago when it bought 1.75.

Using my global weightings, ‘my’ index rose 16% in GBP terms.
The other benchmark I track is VWRL Vanguard’s world equity tracker. With the US now almost 60% of global benchmarks, and S&P up more than double other markets, VWRL rose 18% in 2024.
Q2 How did I do, vs my benchmark?
Portfolio growth
My portfolio rose 16% in 2024. Almost exactly in line with my weighted market benchmark. 16% sounds like a good number versus my long term average of about 9.5% p.a. However in fact, I never actually see exactly 9.5% returns; years deliver either a lot more than that, or a lot less. So 16% is essentially my ‘median’ result; it is the 6th best result out of the last 12 years.
One way to think about my portfolio’s allocation is that my leverage – my portfolio loan – is being used to buy Fixed Income. My loan is about 16% of the portfolio’s value, and my Fixed Income allocation is about 18%. So you could say I have taken out a loan on the Equity house to build an extension, and the extension is Fixed Income.
This isn’t usually how I think about it, because I think I would have some Fixed Income in all weathers, whereas I wouldn’t have c.100% equity exposure if I didn’t have a margin loan. But for the purposes of my mental arithmetic, looking at my portfolio and saying “‘”I have about 20% leverage, which I used to buy assets which fell about 1% in the year, and I pay 6% interest on” is roughly what happened. I.e. my portfolio was negatively impacted by everything that wasn’t equities, including my leverage.
In any case, your actual mileage will vary primarily based on how much exposure you had to US tech, either directly or via S&P500. Any portfolio that was primarily US equities will have done better than mine, and any that had less than 50% exposure to the USA will have been unusual to have achieved 16% gain in the year.
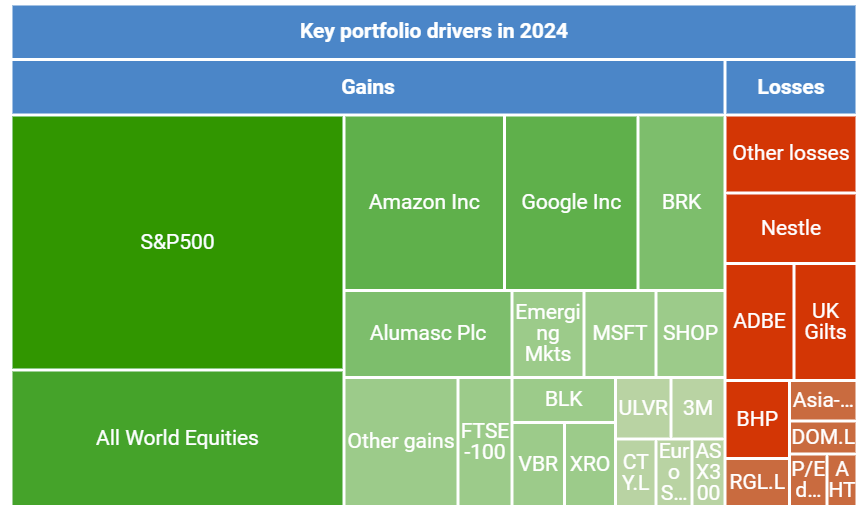
Breaking down key contributors to my portfolio in 2024 shows the importance both of the S&P500 and within that of the Magnificent 7. I own three of the seven, AMZN (+53%), GOOG (+41%) and MSFT (+14%) . Amazon and Google are big holdings and were two big contributors to my +16% 2024 result. The non-magnificant tech was more of a mixed bag; SHOPify rose 50%, and non-US listed XeRO had a good year at +62% but ADoBE fell 26%.
The treemap below shows the major contributors to my portfolio’s growth in 2024. It is approximate, showing the price/share movement weighted by the initial holding – it doesn’t allow for purchases/sales during the year, nor for dividends. Holdings are ETFs/index funds unless otherwise labelled. Aside from the market indexes and tech impacts mentioned above, notable performance drivers were:
- Alumasc PLC, a small cap (‘FTSE Fledgling’) UK manufacturer for the building/engineering sector, was up 74% on the back of decent trading momentum
- Nestle was down 25%, on weak/flat trading. I have this holding as something of a Swiss bond proxy – a defensive position in case of GFC-like episodes – and it remains in positive territory compared to my purchase price, but only just. Its rival UniLeVeR is up 16%, with new leadership showing sharper focus than previously.
- Berkshire Hathaway was up 23%. This is arguably an S&P proxy, though with less of the Mag-7 tech exposure (especially after selling 69% of its Apple stock).
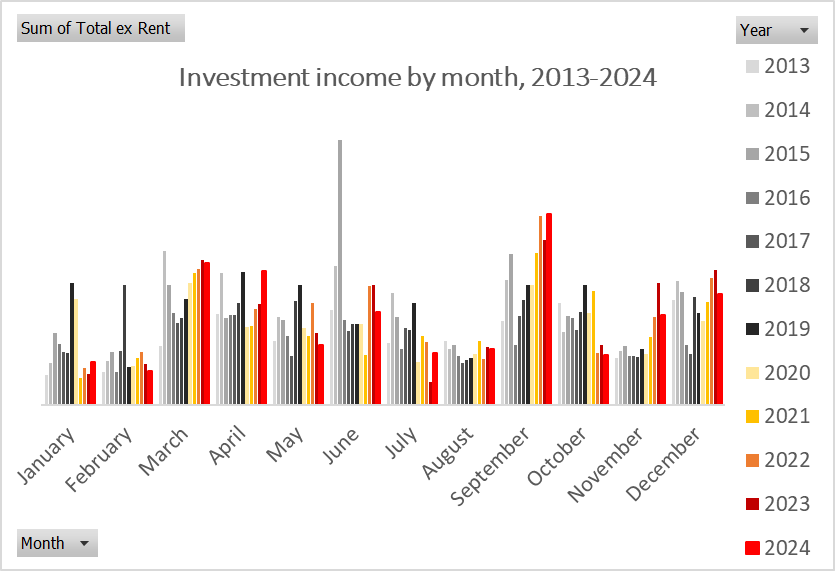
Investment income in 2024
Turning to investment income, which I track across all my self-invested assets including my SIPP. I received slightly less investment income in 2024 than the previous year, which was itself down on 2022. This is a bit surprising, because my overall portfolio has grown significantly, so the investment yield has fallen. One of the reasons is the forced retirement of some of my high yield preferred shares BWSA and RSAB which both yielded around 7%.
Meanwhile my earned income rose slightly. So from a very simplistic FIRE way of looking at things, I went backwards in 2024 – my investment income now covers a lower proportion of my earnings than it did in 2023. I am not going to be too analytical about this as there has been a change in the property / buy-to-let aspect of my investment income that I shall explain in a forthcoming blog post.
As in 2023, I continued to dip into ‘capital’ to make ends meet in 2024. However those ends being met included things like investments in illiquid investments, pension topups, etc so I am at peace with it.
Debt / margin
Lastly, let’s look at my portfolio margin.
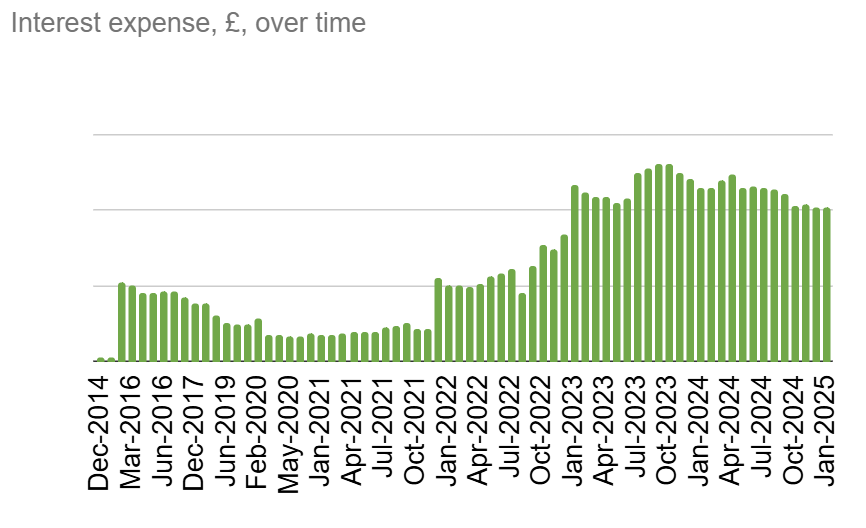
As far as interest costs go, 2024 has been a good year. Base rates fell helpfully in 2024, reducing my blended cost of funds from 6.71% to 5.94% – which has reduced my interest bill by around 10%.
On top of this, I repaid around £200k of margin loan. That’s the good news. The bad news is that I then tapped the facility for over £100k for a couple of investments / loans I made during the year. Net, I finished the year with a loan almost £100k smaller than I started.
The combination of cheaper debt and smaller debt has made quite a difference to my interest expense, as shown on the graph below (and, in a different colour, on my monthly returns page).
I will look at the overall leverage level in the ‘risks’ section below.
Q3 What is my progress towards my retirement goals?
My retirement goals remain unsatisfyingly unclear.
However, there are a couple of crude ways I can assess them.
As I mentioned above, my investment income is now (slightly) lower, and my earnings are (slightly) higher, than a year ago. So in some respect, retirement feels further away, not closer. This ignores the fact that I could live on my investment income, but it also ignores the fact that I enjoy my work.
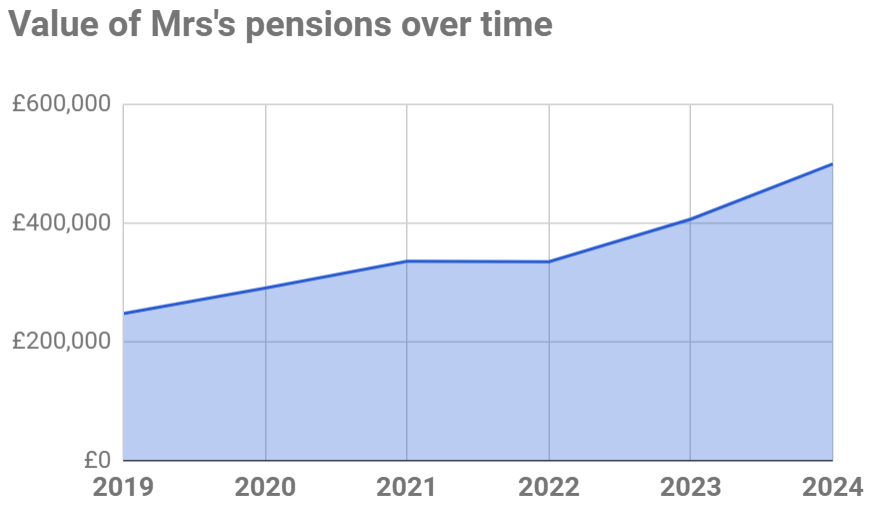
Another crude yardstick is Mrs FvL’s pension, which I am a big contributor to. While my pension is well over £1m, and further contributions above £10k p.a. are not tax-efficient, Mrs FvL’s pension remains a long way from ‘full’. We contributed about £40k to it last year, helping it grow to just over £500k. I want to see this exceed £1m before we officially ‘retire’, and I think that is at least five years away.
Q4 How tax efficient is my portfolio?
Next in my annual portfolio ‘MOT’ (‘health check’, for overseas readers): how tax-efficient is my portfolio?
2024 saw a continuation of my age-old strategy – not to withdraw money from tax-sheltered accounts such as ISAs, SIPPs etc. And then each tax year I top up my tax-sheltered accounts as much as possible – effectively moving money from the taxable accounts into tax-sheltered accounts.
However, one unusual development was that I sold a property – more on this in a later blog post. These funds, which were previously not included in my ‘investment portfolio’, were redeployed into my invested portfolio. For tax-efficiency reasons, the majority of these funds were moved into Mrs FvL’s accounts, as she is a lower rate taxpayer than me. In principle, this means an enlargement of my taxable portfolio.
Set against the influx from property were some outgoings for illiquid investments – I treat these as withdrawals from my investment portfolio, and they then cease to be tracked by the vast majority of this blog.
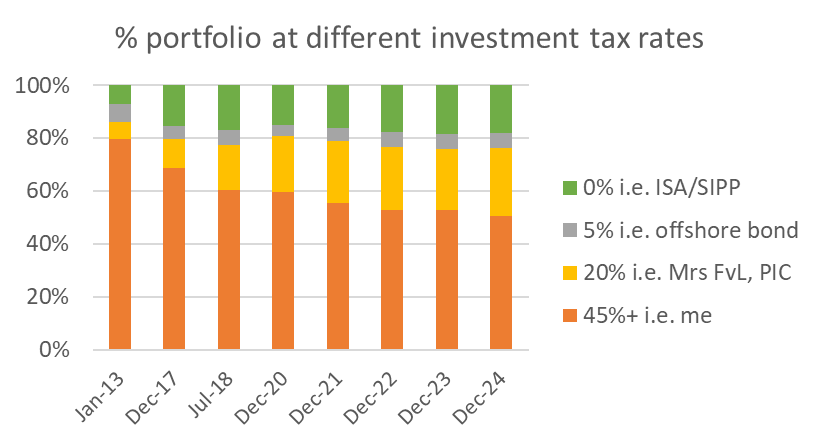
In 2024, the tax efficiency of my portfolio slightly improved – as shown in the graph below. Alas, my marginal tax rate on taxable income is now 45% – the ‘additional’ (highest) tax rate in England & Wales. Nonetheless, taking the weighted average tax rate across all my (and Mrs FvL’s) accounts, my blended dividend income tax rate has dropped very slightly; it is still around 30%.
Q5 What fees am I paying?
For most people, their single largest household expense is housing – either rent, or the mortgage payment. I’m fortunate in having neither, but I do have a significant expense – my investment charges.
The largest single set of charges I pay are still to my private bank, which holds a (shrinking, slightly – see below) minority of my portfolio. I pay it just over 1% of the assets I hold with it, including custody charges, advice fees, and other charges (but not including interest expenses on the margin loan).
My other funds incur much smaller charges. The majority of these are the ongoing charges levied by ETF providers Vanguard and Blackrock/iShares. There are also platform fees – especially on an offshore bond, but also on each of my brokerage accounts. Overall these average about 0.2% of the assets in question.
Taking all accounts and all fees into account, my total fees fell slightly in 2024 as a % of my total portfolio. My total fees were 0.43% of my total AUM. I could more than halve my total charges if I sacked my private bank, but the improvement in my overall portfolio wouldn’t be very significant. I try to forget that these fees in aggregate amount to almost 20% of my investment income – and even more of my taxable income!

Q6 How complex is my portfolio?
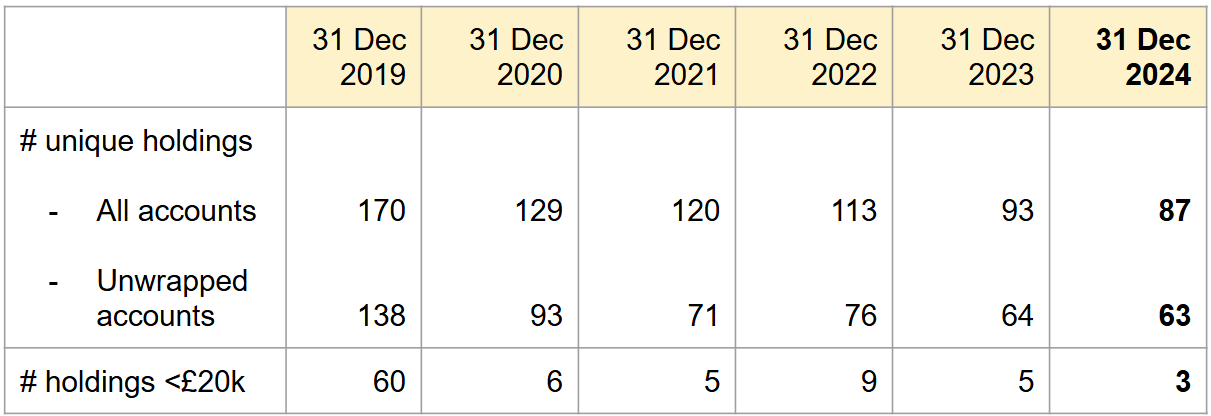
The next question in my annual process is: how complex is my portfolio? I took significant steps in 2020 to simplify the portfolio. And I doubled down again in early 2023. 2024 saw further continued streamlining, leaving me with now ‘only’ 87 unique holdings, and just a handful of ‘small’ holdings. My unwrapped accounts – where the complexity shows up in my tax reporting – do still have 63 (2023: 64) unique holdings.
Q7 What key risks am I taking?
The final question in my seven step review concerns the risks that I am running. Obviously investing requires risk, but what are the structural risks that I run, not those incurred by individual investments?
The most important question here is leverage. Smarter and wiser people than me say you should never ever combine leverage with investing. So while I remain wilfully stupid on this front, that doesn’t mean I ignore the advice – indeed I pay close attention.
2024 saw significant reduction in my leverage and the risks it creates for me. I mentioned above how interest expenses have dropped over 10%, and how my overall loan has shrunk a bit in absolute terms. Alongside that, the portfolio has grown significantly – reducing the loan as a % of the value. My total loans now amount to around 15% of the total value of my portfolio’s holdings (2023: 17%).
The graph below (a version of which is shown on my monthly returns page) shows a clear trend towards a smaller and smaller loan – and I expect to be able to continue this trend in 2025.

Moving on from leverage, another risk I worry about is one of my providers having a problem. In theory, a stockbroker account is client funds – and not to be used by the broker/provider. In practice, as example after example over the years has shown, it pays to be careful.
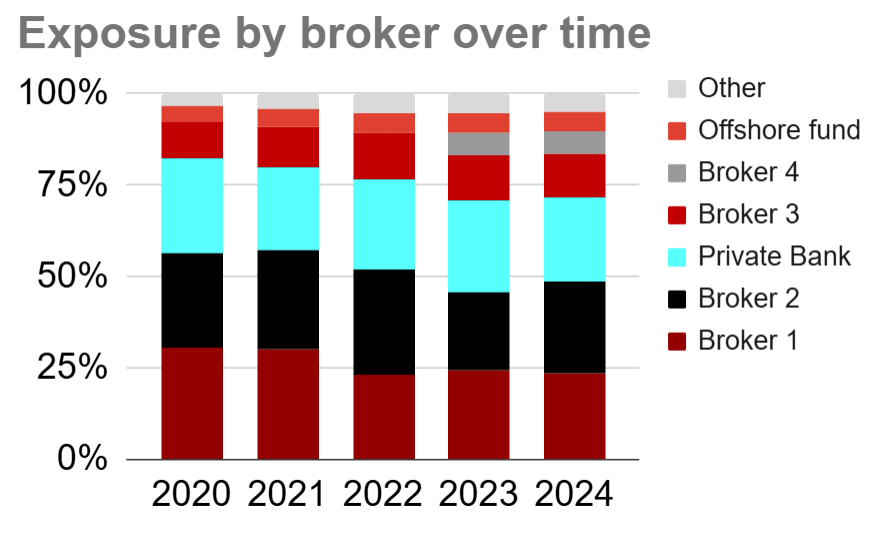
I remain diversified across platform providers. My largest two accounts amount to just under half my invested portfolio (down from almost 60% three years ago – see chart below, showing % net assets by provider). Broker 2 received the bulk of the property proceeds I received this year, which makes it (by a whisker) my largest single provider.
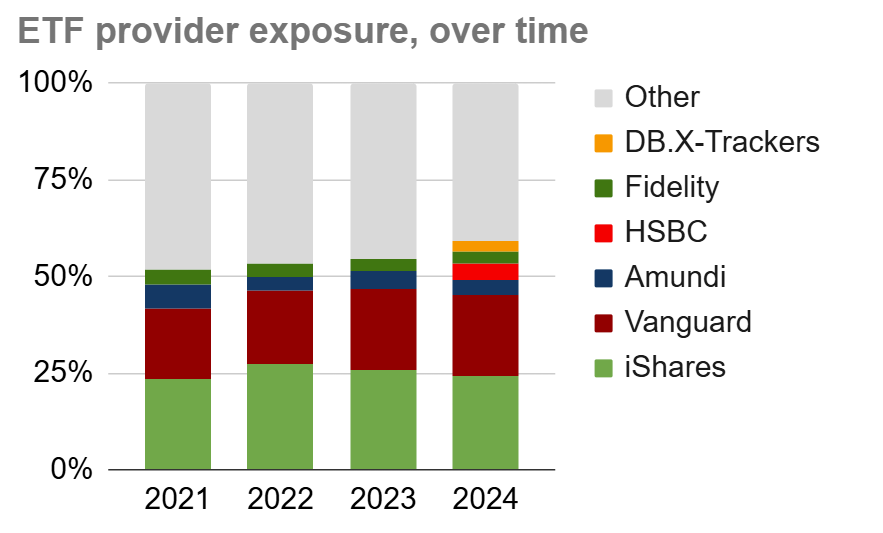
I also pay attention to diversify across ETF providers. The graph below shows my exposure to fund/ETF providers. Blackrock’s iShares remains my most common provider – they hold just over a quarter of my invested assets. Vanguard is not too far behind them. HSBC has now surpassed Amundi/Lyxor as my third biggest ETF provider, with Amundi’s policy of paying dividends only annually seeing me shift some assets away from it. None of these exposures represents a serious threat in case of failure/fraud/theft/etc, though to be clear if I lost ~25% of my invested portfolio that is a lot of money.
In conclusion
It has been a relaxing year for the portfolio. US equities up by a quarter have helped lift my portfolio steadily, allowing me to end up 16% up. Meanwhile, base rates have been falling. The bigger portfolio coupled with cheaper debt has meant I have had very little to worry about this year. Fees, tax efficiency and complexity are all slightly improved on the previous year, and very much in levels I feel comfortable with.
The key question going into 2025 is what will happen to USA equities. But what will be will be. I am as well positioned as I have been since buying my Coastal Folly at the end of 2021.
Appendix: Media during the month


Very interesting read. Thank you.
Back to back years like that are certainly welcome, although I fear we’ve been borrowing from the future. I managed 20.96% TWR this year with my boring 6 ETF portfolio (my head hurts just thinking about your 87 individual positions!). My largest position (now 38%) is VGT… so I’ve been lucky enough to be hitched to the right wagon (I bought heavily during the tech swoon as rates were going up a couple of years back), enough so to offset my underperforming allocations to AUS and EM (about 25% total, split evenly).
I’ve not been adding any cash to my equity portfolio in the past 18 months or so as I’ve been building a “bond tent” – I’ve gone part time at work and looking for any excuse to call it a day. Since I haven’t been adding cash – I haven’t been prompted to “rebalance” by selecting things to buy, and since I still see big tech as being in a very strong position, I am reluctant to incur capital gains to rebalance into things I’m not feeling so positive about (I know, I don’t know any better than the market, but… ). CGT where I’m living right now is 30%, and I’m up about 130% on VGT, so giving away 30% of those gains is not appealing in order to buy EM! The mega cap tech party has to end at some point, but I can’t predict when we will run out of greater fools… so I’m inclined to keep riding the wave for now, come what may. I still think mega tech is in a strong position given the structure of the world these days – it really is a winner takes all environment for global tech businesses, and I don’t see that changing any time soon without government intervention.
LikeLiked by 1 person
Congrats on your TWR.
I broadly agree with you on all points.
My hunch about what might pop the bubble is China raining on Tesla’s parade, in a way that triggers contagion with Aaple, MSFT, etc. Something like that. It doesn’t have me reducing my position but at least my eyes are open. . Maga trashes Mega?
LikeLiked by 1 person
Thanks – mainly dumb luck. Buying into the wall of pain when tech was getting hammered as rates went up was unpleasant at the time, but has worked out very well for me (VGT is up over 100% from the lows in 2022!).
From what I have read, Trump has historically seen the market as a measure of his success as a president. So I’d be surprised if he would do anything to intentionally take markets down by slamming big tech. Most of the Trump 1.0 policy changes were very pro business (reducing regulatory burdens and taxes). The silicon valley crowd are very active political donors. I just can’t see any aggressive big tech regulation coming from the US over the next four years, and without the US, what can the EU realistically do in isolation? Perhaps I’m biased with my oversized VGT position that has been running hot the past few years, greedily holding onto the punch bowl and not wanting the party to end… I’m sure it will, but I just don’t see the trigger at this point.
The AI hype feels very “bubbly” to me, but the majority of big tech companies still have solid products and services that form large parts of the backbone of the economy today. AI heavy darlings aside (Nvidia and the like), valuations are rich, but I think there’s some way to go before we’re in the peak of the south sea bubble frenzy zone. With all of this said, I’m mentally fully prepared for a 30% pullback, and think it would be healthy for the market!
LikeLike
I agree re domestic regulations.
However he is very keen on China bashing and I think China will be thoughtful about which chain to jerk. Tesla seems like an interesting one; China really matters to Tesla, but China no longer needs Tesla. Hitting Musk rather than Trump might be an interesting opening salvo.
The other scenario I can imagine is that AI capex spend is cut, and this results in a profit warning/etc from NVidia, and suddenly everything spirals south fast.
LikeLiked by 1 person
Happy new year – thanks for the update.
I’ve been trying to fill my wife’s pension, but as she is now a home maker, she has very little income. I’ve matched what she has made working odd jobs as an editor for the year, which amounted to around £5k. I read that we can’t use dividends or rental income to count toward her annual pension allowance.
I assume your wife earned £40k from a job for you to be able to contribute that, or is there another tax trick that I’ve missed? Maybe your investments are held in an LTD and your holding company pays your wife a salary (I’m guessing!)
LikeLiked by 1 person
Thanks SN and happy new year to you too!
It took me a few years to figure this out. She is a Director of my Ltd and it makes pension contributions to her SIPP.
LikeLike
Ahh, makes sense!
Moving to a investment holding company structure is probably a fair way off before it makes financial sense for us, unless we stay in the UK and our GIA continues to grow, but I wouldn’t want to realize the gains to transfer into an LTD.
We’ll probably be better off hustling more to make more income that we can chuck in her SIPP.
It would be great if they saw the married couple as a unit and counted total household income.
LikeLike
Does this work if the company isn’t trading and is just a FIC?
LikeLiked by 1 person
I believe so, but you should dyor / tyoa
LikeLike
Great update — I love the way you break out the diversification across fund groups as well as platforms, I need to think on that further — and Happy New Year!
As I was reading I thought: “He’s sold the Modern Flat” and it seems that you finally did?
Re: debt / the margin loan, glad to see this is still looking manageable. What is included in ‘portfolio gross assets’? From memory you don’t include your angel/unlisted things in there?
Anyway I wonder if you might find it useful to graph LT-Liquid-Value (i.e. everything you could sell right now) or even LT-Cash-Like-Value (cash and government bonds and perhaps IG bonds).
Just for another angle on where you’d stand should the crunch come, which given your careful management seems like less of a worry than ever, I concede. 🙂
LikeLiked by 1 person
Thanks for the comment! And HNY to you too TI.
You are onto me re the Modern Flat…. a more indepth post is planned.
My portfolio gross assets are all publicly traded liquid assets. So LT-Liquid-Value is basically the graph I am using. Liquid within a week. It includes some e.g. Funds that take a few days to settle, but nothing would take more than a week. A few holdings are pretty illiquid but not at a material % of my overall portfolio value.
Illiquid holdings like angel holdings, VC fund investments, are *not* included under my definition of ‘investment portfolio’. Nor are my properties (with a couple of rare exceptions – e.g. my earned vs unearned income analysis last year – which I try to be completely explicit about). In a crunch they would most likely remain illiquid and be no use to me.
In point of fact my net worth is at least double my investment portfolio, so the risks I’m running are even lower than my analysis suggests, but to your point – in crunch time what I care about is what I can access quickly.
LikeLike
[…] are really checking the risk and efficiency of the portfolio. For a fuller analysis of this, see last year’s update – not much changed in 2025. However I can report that my blended tax rate actually fell […]
LikeLike