
Last month saw “La rentree” – the return to the real world, after an enjoyable summer. Very much so for me, as it happens – but with plenty of enjoyment still to be found.

I’ve taken in Frida Kahlo at the Tate Modern, a spot of luxury in the south of France, a City ritual in one of its ancient livery companies, some politics both in Liverpool and Downing Street, and the outdoor beauty around Dorset’s Lyme Regis as well as Hampstead’s own heath. Not to mention some sailing, fine dining, and wine tasting, It’s a wonder I find any time to write this blog.




Market movements in September 2026
Meanwhile, the markets were generally gloomy – as elevated oil prices pushed up inflation expectations, lifting interest rates. The Fed’s first hike of rates boosted the USD and hit US treasuries, as to be expected. Equities drifted very slightly lower outside the USA.
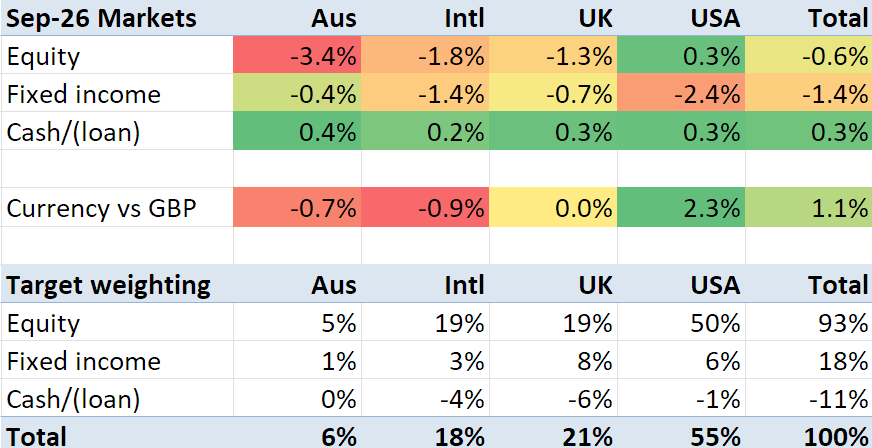
In constant currencies, markets fell (weighted to my target allocation) 0.8%. The currency movements lifted things 1.1%. Overall, net of currency movements, my benchmark rose 0.3%.
My portfolio
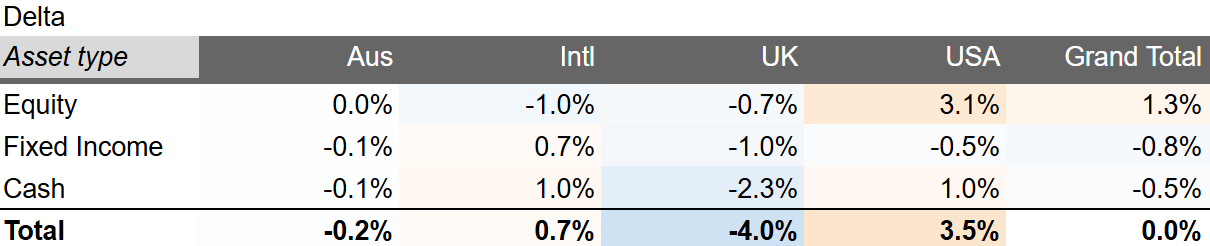
My portfolio saw a slight drop of 0.9% during the month, lagging the wider benchmark by about 1%. Notable losers in my portfolio included: an (unnamed) now-public angel investment of mine, Xero (-32%), IG Group (-29%), Dunelm (-11%), and Admiral (-10%). Sadly I did not have any significant gainers to counterweight these drops! Within the mag-7 I think I was roughly flat; Amazon dropped 4%
I asked Claude to deconstruct my return into alpha (my performance vs the market) and beta (the market). It tells me the biggest negative alpha is my private bank’s account, and observes “That gap shows up as negative alpha, mainly in US equities, so part of that £XXk is timing rather than real underperformance”. Looking a bit more carefully, I pulled the bank’s portfolio into my tracking a system a day before one of the other accounts, and the bank’s own reporting is lagged by a day. A two day lag can make quite a difference, and appears to be doing so here: VUSA rose 1% from 1 Oct to 2 Oct for instance. I’d like to think this sort of randomness cancels out over time.
I remain a bit overweight on USA equities. I am struggling to liquidate/rebalance here without crystallising some nasty capital gains. If I was more worried about the prospects of the Chancellor upping capital gains rates in the budget in two weeks’ time, I would bite the bullet – but I am not that worried.
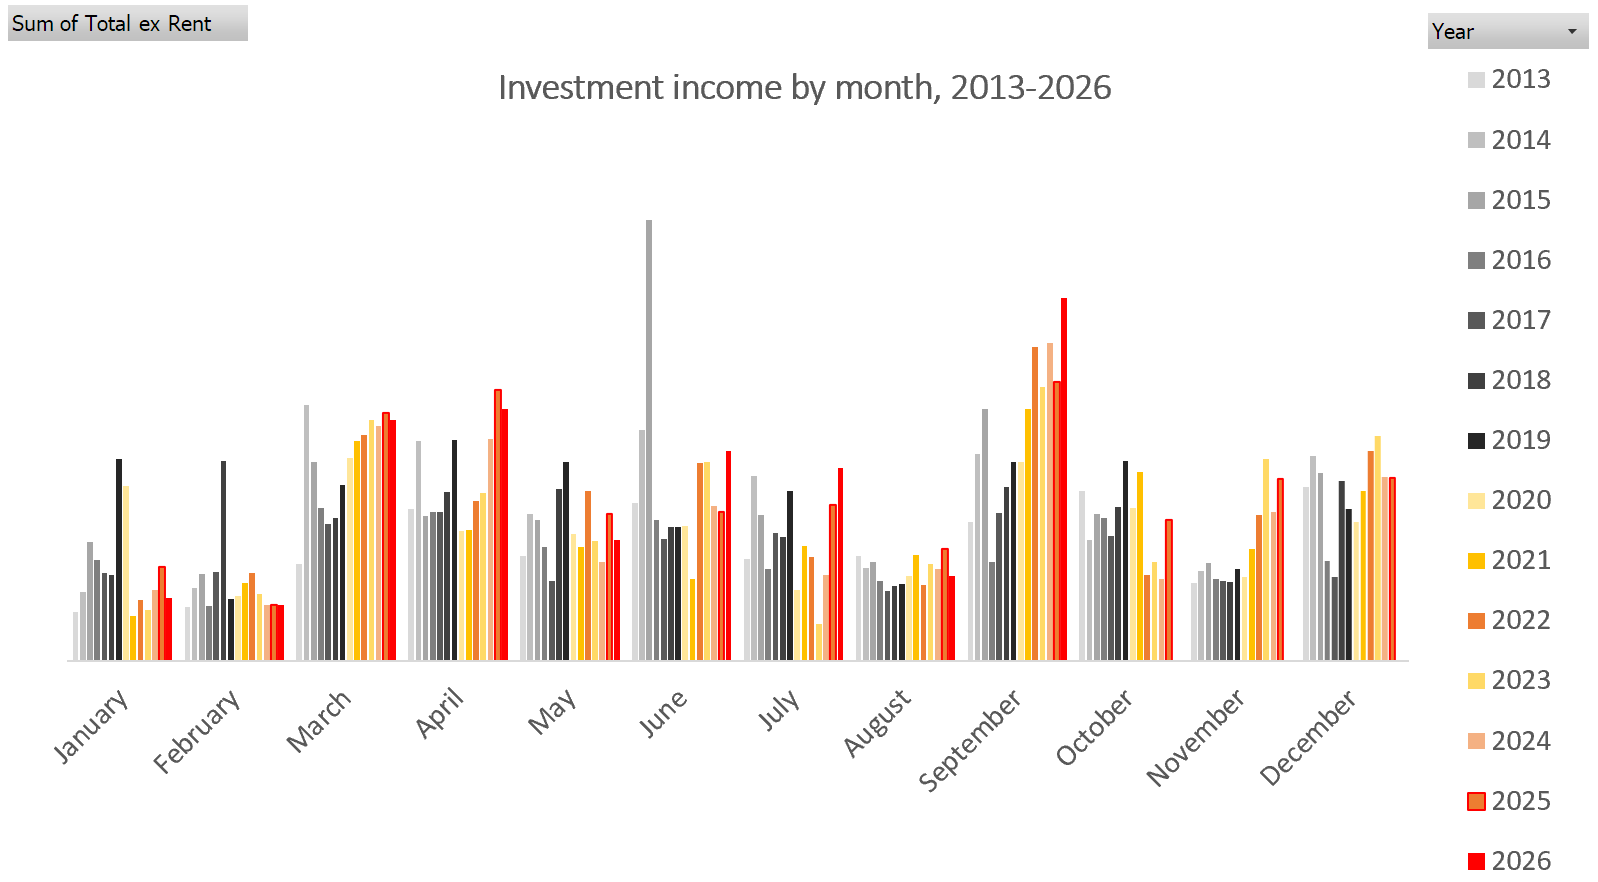
Meanwhile, over on the income front – September was a bumper month. It is usually a strong month. But September 2026 was my biggest month for income ever, early 2014 when Vodafone’s extraordinary payout after selling their Verizon Wireless stake led to bumper dividends.
Septembers are now months when my money makes much more money than I do. I wonder how long it will take for that to be true in
Appendix: Press clippings