
August was another fabulous summer month in the UK. The lack of rain became a nasty drought, with hosepipe bans across much of the country – including my Coastal Folly’s Wessex Water supplier (for the first time in over 50 years). But lawns aside it made for an enjoyable month.
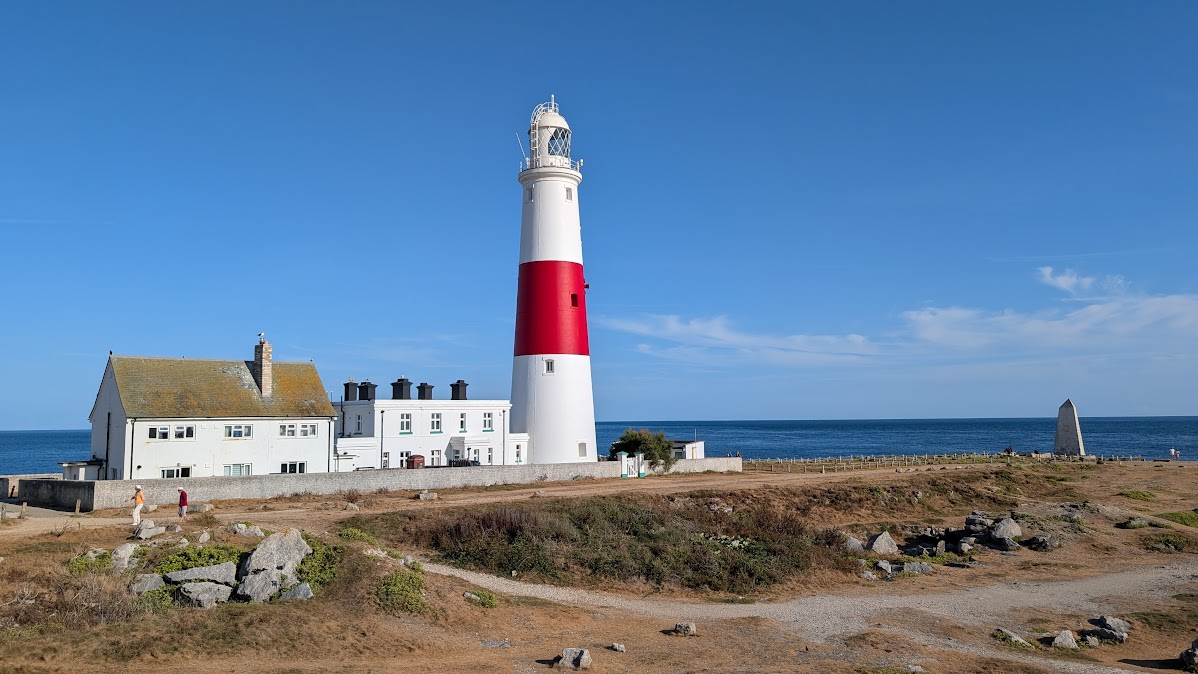
I spent quite a bit of time on the south coast. I finally ticked off the Isle of Wight’s Osborne House from my bucket list, and also made it down to Portland’s lighthouse – Dorset’s southerly point.

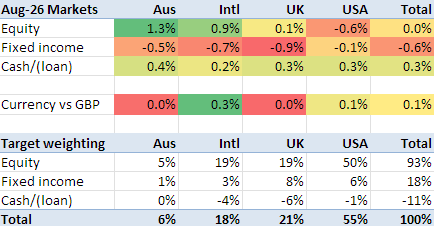
Markets in August
Markets didn’t move much in August. My markets moved, on average and after currency movements, up 0.5%. The most notable component was a slight drop in bonds, with Trump/Hormuz-driven inflation looking more persistent than it had appeared a month earlier.
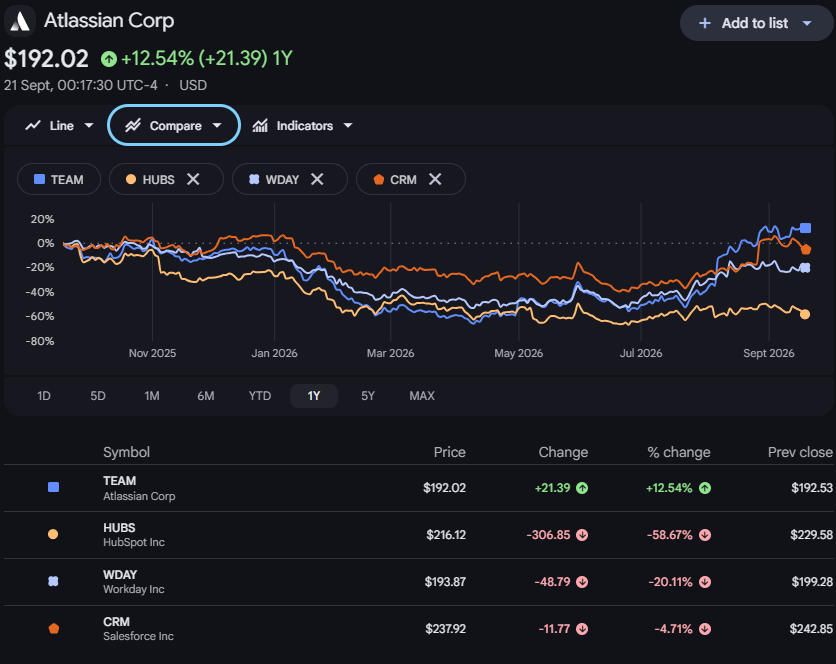
The equity trend of the year – the SaaSpocalypse – is now starting to feel like old news. Some stocks that were hammered by it are now trading up above their pre-1-Jan stock price. Hubspot remains very bruised, as does (not shown) XeRO – in which I have a significant position.
My portfolio in August
My portfolio returned 1% in August, a little more than the markets I track.
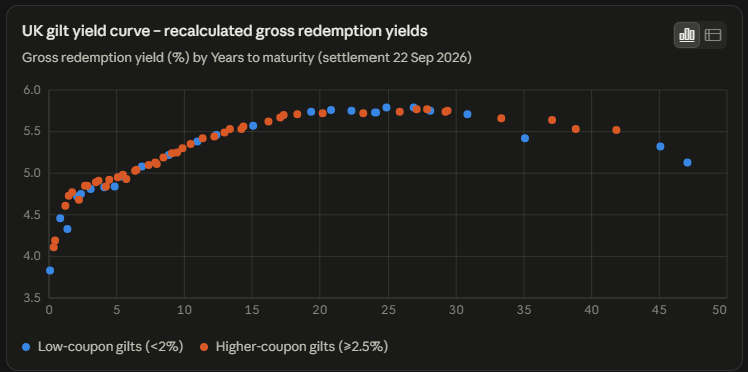
Government debt costs remain a recurring theme in the finance/business pages. The longer term debt costs for US and UK have been rising, with the UK’s approaching 6%. I took the opportunity to buy some 20 year 4.25% UK gilts, at around a 6% yield (5% through coupon, 1% through capital gain to maturity). This is a government-backed 3x my money, before inflation. Most of this purchase was funded by selling down my NWBD position – a long term income play with a nasty bid/offer spread.
August was as usual a relatively light month for dividends. September will be much juicier.
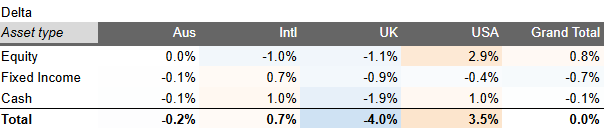
My overall portfolio remains roughly in the same balance/imbalance I’ve sustained for a while – slightly overweight USA Equities, slightly underweight UK equities and bonds. My leverage is almost exactly on target. Not a lot going on, all in all.
Appendix: August 2026 Press clippings