
We started March in the midst of a war in Europe (or, for my Russian readers, a ‘special military operation’). Scenarios such as a rapid Ukrainian defeat, or alternatively escalation to a nuclear confrontation were being discussed in the media.
We ended March with Ukraine very much still in the fight. In fact Russia has for now given up on taking the capital Kyiv. Nuclear confrontation feels less likely than it did a month ago. But, as with all wars, it’s going to last longer than we feared.
All of this is not at all good news for energy costs, supply chains, or the wider economy. It won’t be long before a major European/N American economy reports double digit inflation.
Given this context, it is no surprise that bond markets dipped significantly in March – dropping 3-4% across the board. But there is a welcome surprise of a resounding rise in equity markets in the month.
The UK markets, which as the poster child ‘old economy’ stockmarket, had held up quite well in recent months, and rose less than others. But the US and Oz markets rose about 6% each. In Australia’s case, the currency gained appreciably too – becoming stronger than it’s been for a while.
The blended average of my markets rose by 3%, in constant currency terms – due to my exposure to the increase in equities being far higher than my exposure to the drop in bond values. With the strengthening of USD and AUD, this led my markets to increase by 4.5%. Against that, my actual portfolio rose by 4.4% – roughly in line.
This increase in value was welcome in March, because I am currently dipping into my capital quite significantly. The recent purchase of the Coastal Folly has led to a variety of subsequent expenses causing record credit card bills. And back in the Dream Home, Mrs FvL has been started a major renovation project which is going to cost £100k+ upwards when all is done. All of this is happening while my leverage is uncomfortably high.
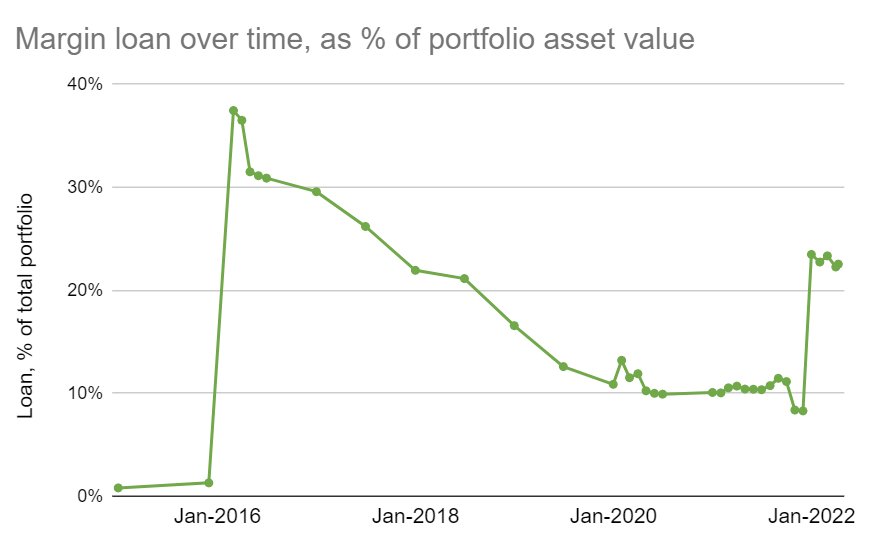
But as well as markets rising, I have also benefited from a couple of small ‘windfalls’. I have received a five figure compensation payment and a small (but five figure) venture capital distribution from a fund I have invested in. These have allowed me to make a modest repayment of my portfolio loan. All in all, my Loan-To-Value ratio has dropped slightly. At the time of writing here is the graph over time (live version shown here):
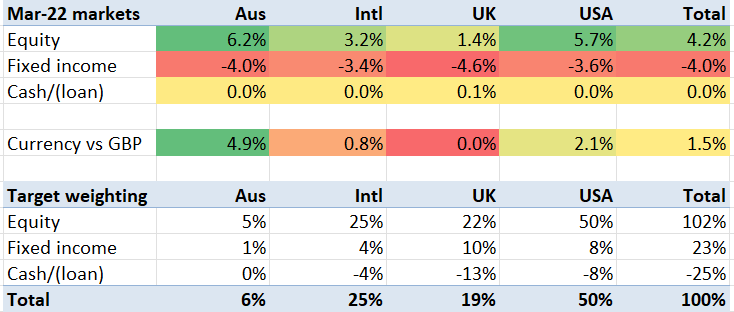
Below I show my current tracking error versus my target exposure. You can see my cash/leverage position remains significantly off my long term target, in GBP particularly (I should really borrow more USD to buy some GBP, but haven’t got around to it).

The other aspect of my portfolio I pay attention to is my investment income. Covid-19 and the associated lockdowns gave the economy a beating, and resulted in a dramatic drop in dividends – admittedly in a bit more ‘slow motion’ than one might have expected. So far, it is still hard to see whether we are returning to normal. April will be a key test – as April’s dividends were about one third lower in 2020 and 2021 than 2019. But in the meantime, as shown with my ‘weenie chart’ below, my March dividends were fractionally up on the previous year. I am hoping for a bit more uplift in April.

Finally, I wish all my readers a happy new (UK tax) year. Us UK taxpayers have a fresh of set of allowances to be seized. More on that in an upcoming blog post.

Nice to see Weenie’s dividend chart format getting a namecheck. 🙂
I love the way it shows growth. Very motivating. Almost enough to turn me back into an income investor!
(Maybe you could adopt her rocket and submarine emojis too on the margin graph?!)
March was indeed nice, but April has lived up to its billing for me and taken nearly all of it away again 😦
LikeLiked by 1 person
I like that format a lot too. However, in my one it is not a unitized analysis, so some of the growth or declines come from changes in the portfolio size rather than compounding effect
LikeLike