
It’s over. The year of 2025, the thirteenth year I’ve been systematically tracking my investment portfolio every month, is over.
One of the reasons I blog is to track my performance with a bit more discipline and rigour than I might manage otherwise. And part of that process is to review the portfolio not just monthly, but with a bit more depth each year.
Seven questions to assess my portfolio
For the last few years I have answered seven questions – with a variety of analyses that I don’t conduct every month. These seven questions are as follows:
Q1 – How did markets do?
Q2 – How did I do, vs my benchmark?
Q3 – What is my progress towards my retirement goals?
Q4 – How tax efficient is my portfolio?
Q5 – What fees am I paying?
Q6 – How complex is my porfolio?
Q7 – What key risks am I taking?
What’s the answer? Lots to like this year
This year is no different, insofar as I have considered each of these seven questions. But rather than simply copy/paste last year’s post, with minor updates, I’m going to cut to the punchline.
2025 as a year was great. In terms of progress towards my retirement goal – Qn3 – which is one of the wooliest questions in my list, I can unequivocably say 2025 was a solid year. This was on several fronts
- My investment portfolio delivered 10.5% for the year. Having said last year that no calendar year delivers my average return of 10%, 2025 just tried to be the exception.
- Moreover, my investment portfolio grew by over 15%, and by over £1m. The reason the portfolio grew by more than the investment return was due to a couple of windfalls over the year – one of which, to be fair, was discovering a long-forgotten account that turned out to now be worth 2% of my total investment portfolio.
- Mrs FvL’s pension grew by 20%, and my pension grew by 15%. My income is too high to make tax-efficient pension contributions, but Mrs FvL’s income isn’t and her pension remains too small. Thanks to the aforementioned investment returns, plus ongoing contributions into both pensions (tax-inefficiently in my case, ho hum), each pension grew in size by even more than the investment return. I don’t need to keep up 20% growth for too many more years to have very decent pension adequacy.
- My margin loan has shrunk, to a size below my long term target leverage level. It has shrunk to a level where my interest expense is back to the level when I bought the Coastal Folly in 2021, which was before interest rates shot up, even though rates are still higher than back then.
- My portfolio income is the highest I’ve had for 10 years – since I bought the Dream Home in 2016. It isn’t quite in excess of my earned income, annoyingly, but it is very close.
So, on the most fundamental question of all – I made very good progress towards my retirement goals.
Never mind the US stock market
Now, back to those 7 questions. The first of them asks how markets did – because at the end of the day that is what will drive our performance. And as most readers will know by now, the markets had a good year. The headlines say the S&P was up 16%, though what they don’t remind you is that the USD fell significantly over the same time period. As it turns out S&P500 actually performed worse than all the major markets I track, except Australia.
The graph below shows selected equity index ETFS all listed on the LSE, i.e. denominated in the same consistent currency (GBP). The graphs show the price of the ETFs – not the total return – i.e. they exclude dividends. As it happens S&P pays lower dividends than FTSE, so if dividends were included they would accentuate the contrast. For instance, Monevator’s quilt says FTSE-100 was up 25.6%, versus the 22.2% shown below, and he says S&P-500 was up 9.4% versus the 8.25% shown below. I assume these differences are dividends.
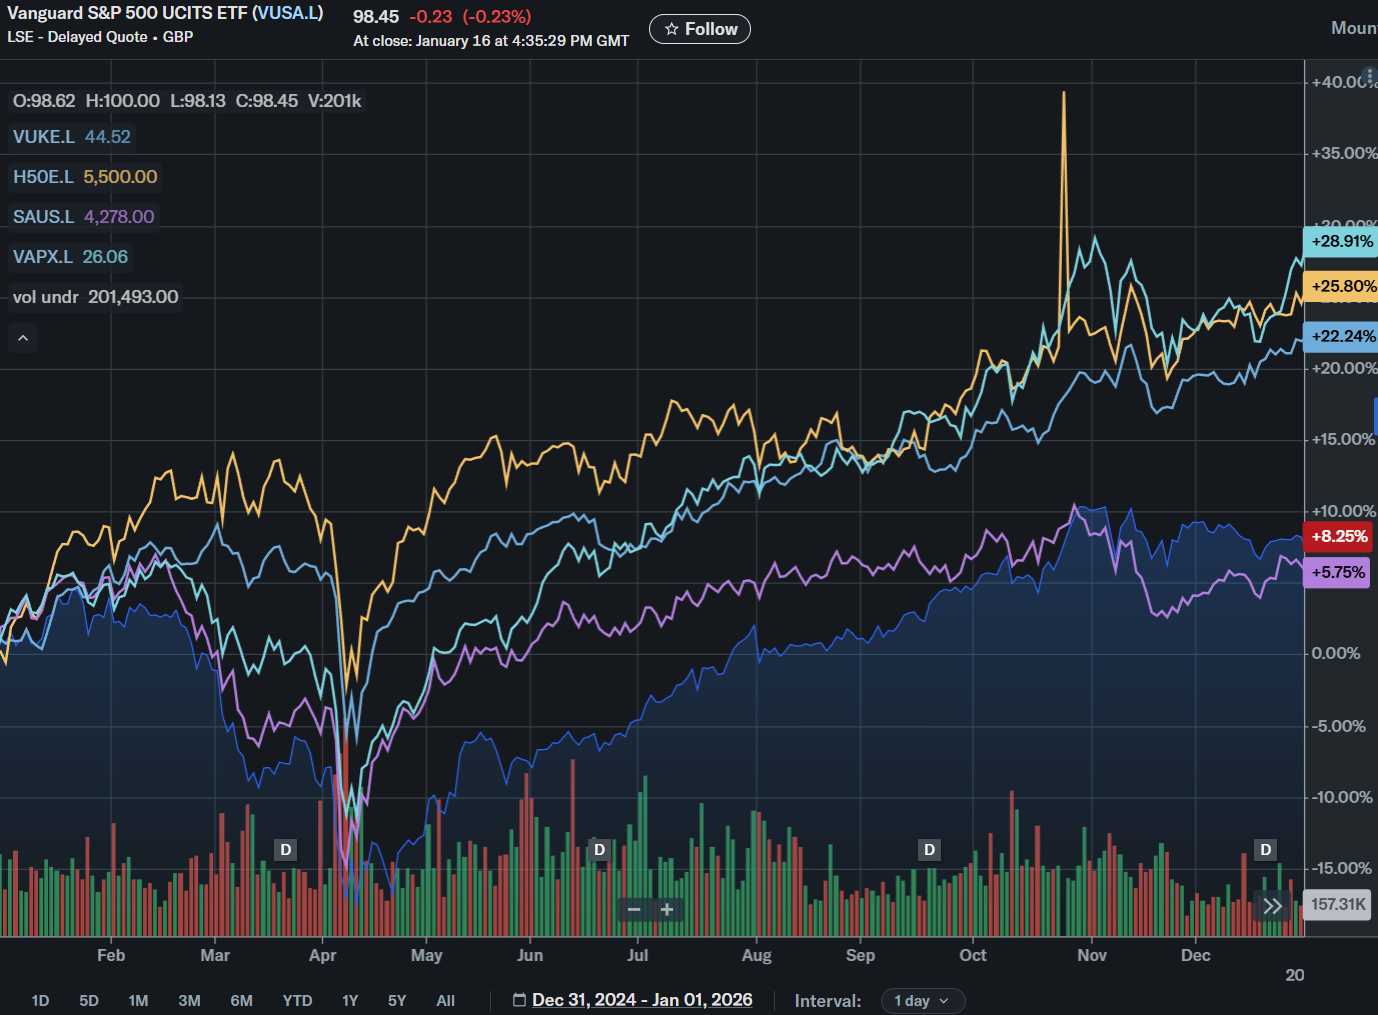
Monevato’s quilt shows UK FTSE-100 beating all other asset classes except Gold. It is the first time FTSE-100 has been in the top two assets in 10 years (versus USA S&P-500 which has managed that in 6 of the last 10 years, and Gold which has managed it 5 times). 2025 was the year to have home bias for us UK investors.
Relative performance not so hot in 2025
Given FTSE return of over 20%, my portfolio return of 10.5% isn’t looking so hot. But with half my assets allocated to the USA, and around 20% allocated to bonds (which returned between 1% and 5%), my weighted benchmark rose by ‘only’ 14%. Even there I appear to have lagged it materially, and will have to settle for merely beating the S&P500. On a slightly longer term basis (2-3 years) I am almost exactly tracking my benchmark, as I would expect.
But everything else is slowly improving
The other questions are really checking the risk and efficiency of the portfolio. For a fuller analysis of this, see last year’s update – not much changed in 2025. However I can report that my blended tax rate actually fell fractionally, despite Rachel Reeves’ best efforts, and my total expense ratio also dropped a tiny bit too to 0.41% of the portfolio. So, on the basis that I was pretty happy last year, and things have got slightly better still in 2025, I remain pretty happy. My exposure across platforms and ETF providers hasn’t changed materially either, although I do now have another offshore bond provider (a really terrible one too – something I want to address) to keep track of.
Appendix: Press clippings


Great summary thanks. Could you do more on “How complex is my portfolio?”
LikeLike
Fair question – I rather skipped over the complexity point! The numbers are pretty similar to the previous year (see https://firevlondon.com/2025/01/07/dec-24-2024-in-review/ ). A tiny bit worse, however, because of the offshore bond we have ‘discovered’. I have 90 unique holdings (up from 87), 64 in unwrapped accounts ( up 1 from 63), and 4 (up from 3) holdings <£20k. I have one more broker/provider (the 'discovered' one). But overall I would say the complexity story is 'no change'.
LikeLiked by 1 person
Do you include US witholding tax in your calculation of expense ratios? I have started to do that and was surprised just how much it adds to the underlying etf/fund TERs. I have started using synthetic/swaps for the US etfs/funds as a result (including separating global etfs into eg SPXP and XMWX) which has shaved several basis points off the portfolio overall TER.
LikeLike
No I didn’t.
LikeLike
The reason the portfolio grew by more than the investment return was due to a couple of windfalls over the year – one of which, to be fair, was discovering a long-forgotten account that turned out to now be worth 2% of my total investment portfolio.
Kudos for admitting and sharing — imagine what might have gone missing if you hadn’t been blogging regularly to better keep tabs on your portfolio! 😉
Congrats on the finishing line honing into view by the sounds of it.
(Reads like investment income topping earned income might be a threshold?)
LikeLiked by 1 person
Nice summary – always interesting to read how folks have done. That was some “penny” you found down the back of your sofa!
LikeLiked by 1 person