
My goals for each quarter are as follows:
- For my net loan to shrink by £10k per quarter, without any margin calls.
- Maintain investment income of at least £Xk
- Closely track my target asset allocation
Goal 1: For my net loan to shrink by £10k/qtr
This goal is proving again to be a wriggly one.
At the end of Q2 I explained that Brexit bargain-hunting had got the better of me, so my net debt had increased by £20k. Given that markets continued to rise in Q3 – my Q3 net portfolio gain was around 7% – this proved to be no bad thing.
In Q3 I have fluctuated. At point point my loan was £80k down from Q2. But September saw it increase a bit. So the loan finished Q3 £40k lower than when it started.
The other relevant measure here, though not one I am targeting as such, is the Loan-To-Value against my investible portfolio. This measure has dropped significantly, to around 29% at the end of Q3. Given that it hit a peak in February of over 37% this is a solid derisking of my exposures.
Overall progress against this goal is a clear PASS.
Goal 2: Maintain investment income of at least £Xk.
Investment income is, in principle, imminently trackable. In practice the reporting lags I suffer in some accounts make this a bit harder than I’d like to keep track of.
All this year I am suffering a steep drop in come compared to the year before, because I sold off so much of my portfolio to buy my Dream Home. But market gains this year, coupled with my leveraged position, should hopefully help me comfortably stay above my income goal of £Xk.
In Q2 I finished about 5% ahead. With some more reporting having arrived I can see in fact I was about 10% ahead of my goal.
Unfortunately in Q3 I have had a disappointing quarter. The previous year some of my biggest holdings were Vanguard ETFs and they paid out in September. This year my main Vanguard ETFs are paying out in early October, just after Q3. And my holdings of these ETFs have dropped dramatically, in place of investments whose dividends/etc pay out over a different time period. My main account in this portfolio has thus seen an 80%+ fall in Q3 income over the year – sniff.
Overall I achieved only just over 80% of £Xk in Q3. I am confident Q4 will see a return to form, not least because of the October income received from Vanguard ETFs, plus some other news which I’ll reveal in a not-yet-written blog post.
So, alas my result against this goal was a FAIL. Given my net worth grew by about 10x £Xk in Q3 I am not feeling too miserable about this.
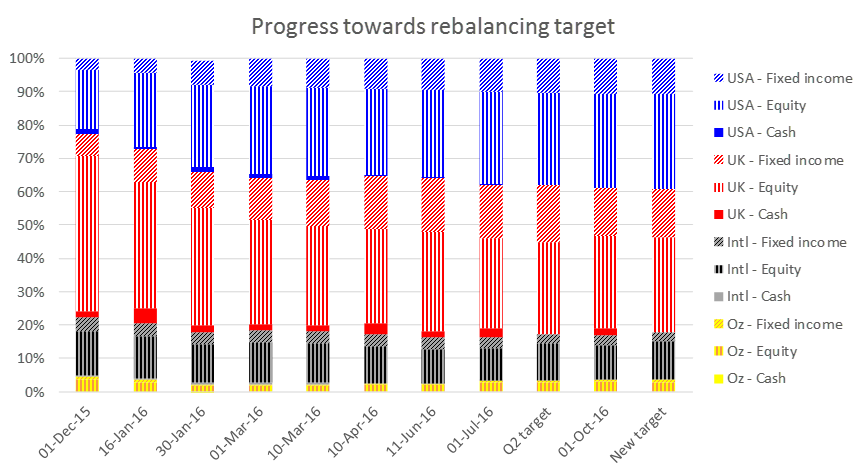
Goal 3: Closely track my target asset allocation.
I finished Q2 very close to my target allocation. I had in fact slightly tightened my target allocation, in favour of equities over bonds.
In Q3 there has been no change to my target allocation – as there usually won’t be. And I’ve kept magnetically close to my target allocation. Nothing to see here, officer. This goal was HIT.

Hi FvL,
Thanks as always for sharing your progress, always good to see. Having sold off a chunk of the portfolio for the dream house (I hope its living up to it! :)) I can imagine seeing the dividend income drop is hard, but as it rebalances out hopefully that wont take long to come back up.
How are you finding things with the margin loan, does it actually feel any different to having a mortgage, or are you now into the routine?
Cheers,
London Rob
LikeLiked by 1 person
Interesting update. I’m revealing my hard-bitten value investor soul when I find myself shaking my head a little when you describe your total exposure as de-risked because your equities have gone up a lot recently. I absolutely get why, and I absolutely know you know why I’m shaking my head just a bit! 🙂 (I note too that you’re saying you don’t target that as much. Good! 🙂 Kill the debt, says grumpy old grandpa The Investor… 😉 )
Re: The graph, perhaps its just me but I’d rejig to put the fixed income portions together, regardless of geography, so I could see at a glance how my equity to bond balance was changing. I think this is more useful than geography, personally.
Or are you worried about currency? Perhaps two graphs then. (Personally I’d probably have hedged most of my overseas bond exposure, though, unless I was explicitly playing the currency).
Just some idiosyncratic feedback. Clearly as you cunningly levered up just ahead of a UK equity boom and have seemingly ridden out Brexit, you may rightly feel inclined to ignore it all. 🙂
LikeLiked by 1 person
[…] had a disappointing Q3 (at 80% of target) but said that I expected Q4 to be much better. I expected an improvement for […]
LikeLike