Phew, what a month.
I thought December was nerve-wracking. Check out how January compares – the UK/US equity markets fell almost 10% in the first 20 days and then clawed most of this back at the last minute. Bonds had a much smoother ride, unlike December.

Those of us, er, trying to fund a major house purchase out of stocks/bonds must be Stark Raving Mad. Not to mention anybody actually borrowing money backed by a portfolio of this rollercoaster.
When you look at the returns by asset class and geography, you see two things clearly:
- Bonds up, equities down.
- USA worst, UK least bad.

Where does this leave me? Well, based on my target allocation, the market has fallen 6.8%. In the month. One fifteenth of its value down, in one twelve of the year. Heavens. In fact it’s worse than that, because right now I’m not at my target allocation – I remain overweight in equities (which are down) and the UK (which is the least bad). The market I’m actually exposed to fell by about 7.8%. This really is down a twelfth in a month.
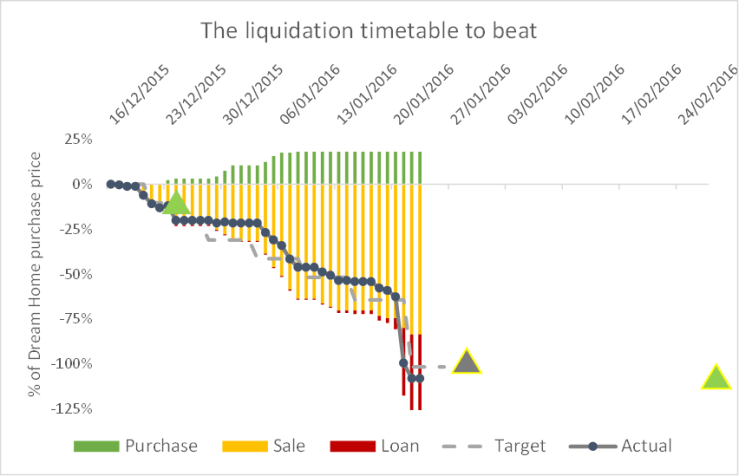
The truth is, I’m lucky. My actual performance for the portfolio I manage was down only 2.2% (though I need to caveat this because unitising my portfolio has been particularly complex with the number of transactions I’ve been performing, so I may yet need to correct these figures). I outperformed my markets by about 5%. How did I achieve this? Mostly, because I was very fortunate with my sales – the bulk of my sales were the week either side of Jan 1st – as my graph above shows this was the right time to be selling. I was selling in one account and bulking up in my marginable account and I managed mostly to buy at lower prices than I’d been selling at. I’ve been range trading FTSE-100 and that strategy, again, continues to broadly work.
Nonetheless, negative 2.2% isn’t helping my performance. At least my worst drawdown remains unscathed at -7%; with my leveraged portfolio this number is particularly key to me. I await February with some trepidation.