And we’re off, into 2025. Before we get too far, it’s time to take stock (pardon the pun) of 2024. I’ll follow the 7 point approach I’ve used for the last few years, starting with the wider market context.
Q1 How did markets do?
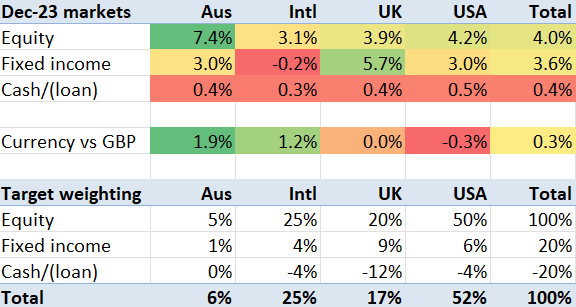
December saw falls across most asset classes – arguably reverting to the mean after the November gyrations caused by the Trump election win. The Australian dollar continued its significant fall, with the markets worried about the Trump tariff threat against China – a key export market for Australia.

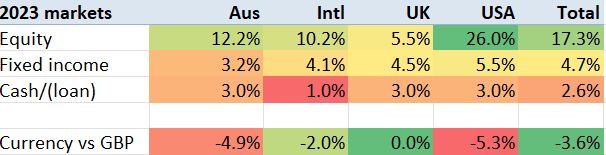
Equity markets’ performance in 2024 look strikingly similar to that of 2023, with the exception of the UK – which returned almost 10% (including dividends), roughly twice its 2023 result. Equities in the USA rose almost a quarter (2023: 26%), and in other major markets rose around 10% (2023: 10% in International, 12% in Australia, exactly the same as 2024).
Bonds’ performance looks quite different to the 2023 figures. US bonds rose 1%, UK bonds dropped 4% and others were flat, whereas in 2023 Bonds rose 3-5% across all major markets.
And looking at currency movements, the pound continued to climb in 2024 against most currencies, except for the dollar – where its initial climb ended up as a modest fall, with USD up 1.8% against the GBP. The pound now buys over 2 AUD, a striking change from 2 years ago when it bought 1.75.

Using my global weightings, ‘my’ index rose 16% in GBP terms.
The other benchmark I track is VWRL Vanguard’s world equity tracker. With the US now almost 60% of global benchmarks, and S&P up more than double other markets, VWRL rose 18% in 2024.
Q2 How did I do, vs my benchmark?
Portfolio growth
My portfolio rose 16% in 2024. Almost exactly in line with my weighted market benchmark. 16% sounds like a good number versus my long term average of about 9.5% p.a. However in fact, I never actually see exactly 9.5% returns; years deliver either a lot more than that, or a lot less. So 16% is essentially my ‘median’ result; it is the 6th best result out of the last 12 years.
One way to think about my portfolio’s allocation is that my leverage – my portfolio loan – is being used to buy Fixed Income. My loan is about 16% of the portfolio’s value, and my Fixed Income allocation is about 18%. So you could say I have taken out a loan on the Equity house to build an extension, and the extension is Fixed Income.
This isn’t usually how I think about it, because I think I would have some Fixed Income in all weathers, whereas I wouldn’t have c.100% equity exposure if I didn’t have a margin loan. But for the purposes of my mental arithmetic, looking at my portfolio and saying “‘”I have about 20% leverage, which I used to buy assets which fell about 1% in the year, and I pay 6% interest on” is roughly what happened. I.e. my portfolio was negatively impacted by everything that wasn’t equities, including my leverage.
In any case, your actual mileage will vary primarily based on how much exposure you had to US tech, either directly or via S&P500. Any portfolio that was primarily US equities will have done better than mine, and any that had less than 50% exposure to the USA will have been unusual to have achieved 16% gain in the year.
Continue reading “Dec ’24 – 2024 in review”