Eye-watering energy costs

The UK in the energy vanguard

Here in the UK, many have taken pride in our enlightened energy policies.

We led the world, under Mrs Thatcher in the 1980s, with privatising state utilities – so our gas, electricity, telecoms etc are all in the hands of private companies. Guarding against the natural tendency to monopolies in such sectors are our industry-specific regulators OFCOM and OFGEM.

More recently (though following an initial lead from Mrs Thatcher), we have been one of the leaders in moving to renewable, ‘green’ energy. In 2019 renewable sources exceeded fossil fuel sources for the first time. Not long ago our media was proudly boasting how we had managed to power the country for two months without using any coal.

UK Energy consumption by source, 1965-2020

Not for us the Japanese/German greenery-gone-amok policies of turning off nuclear power mid life. Not for us the hypocritical and myopic German policies of reliance on brown coal and Russian monopoly gas. And not for us using fracking to unleash new reserves under our precious, fragile, green and pleasant land; we’d rather let the Americans do this in their flyover states and then pay them, now a net energy exporter themselves, a premium to liquify it and send it over to us. Who wouldn’t?

And to top it all, the UK has been one of the fastest markets to adopt Electric Vehicles (EVs), hastened by a variety of subsidies and tax incentives. EVs pay lower car taxes, lower congestion taxes, lower parking fees, and could be purchased with the help of several thousand pounds of subsidy. Over half of new car enquiries are for EVs, and over 20% of new registrations are for pure or hybrid EVs.

Being in the vanguard in 2019

The results of these enlightened energy strategies have seen our CO2 emissions fall faster than most OECD countries. We were paying, until recently, only a modest premium for our greenification. Consumers have had a choice of over 70 companies, and many hundreds of tariffs – allowing such innovations as Electric Vehicle-specific tariffs, empty-property-specific tariffs and tariffs accumulating loyalty points. And our privatised, competitive model has been ‘improved’ with a Labour Tory retail price cap, restraining operators from milking the can’t-be-bothered-to-shop-around segment.

The chart below shows what this felt like chez FirevLondon back in 2019. Those halcyon days when I worked away from home five days each week, drove a petrol car, and lived in one house – admittedly my Dream Home. The Dream Home consumed around 46k kWh of energy each year – admittedly far more than an average (smaller) UK household – yet cost me less than £250pcm of energy. My car usage was far less than an average household, so the fuel for that cost me only around £1k per year – ensuring I could drive a large-engined funmobile ‘cheaply’ (25p/mile doesn’t add up to much if you don’t drive many miles!). My total fuel costs amounted to less than £4k per year. Of that, the taxman received around £840 p.a. of tax and fuel duties – chiefly from my petrol car. Energy is taxed at a reduced rate of Value Added Tax (VAT) of 5%, compared to 20% for normal expenditure.

Energy costs p.a. in 2019

How times change

Now, unfortunately, in 2022 it turns out that the world looks completely different.

Continue reading “Eye-watering energy costs”

July 2022 – a red hot month

July has been travel month. Not for me, in fact. But London has been full of visitors – and Mrs FvL and I have been inundated. So much so, that it has been handy to have the Coastal Folly for overspill. But London has a lot to offer and it has been fun doing some touristy stuff.

Summer in London

Visitors in mid July saw the hottest temperatures ever recorded in the UK. London saw 40C for its first time. I confess I was down at the Coastal Folly at the hottest point, where sea breezes kept temperatures to a lovely 30C. So I missed the bring-your-cat-to-the-office mayhem going on up in town.

London weather, mid July 2022

(UPDATED: it was hot in Downing Street too, with Johnson finally resigning early in July. That is too well covered for me to add any value here)

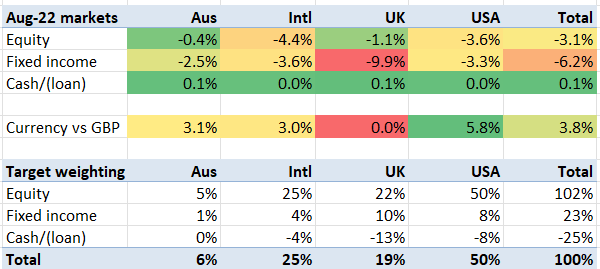
The markets had positive momentum throughout July. VWRL, Vanguard’s world equity ETF, was up throughout the month and ended up 6.2%. Bonds took a bit longer to rise but from mid month they too rose significantly. With the 25% leverage I’m targeting, my markets rose on average just over 6% – the fifth best result in at least 7 years.

Market movements in July 2022
Continue reading “July 2022 – a red hot month”

Life on the margin

This post drills in to the niche that I have found myself in – of having an uncomfortably high level of leverage margin during a bear market. None of this is worth trying at home so for you to continue reading I assume you are anticipating some schadenfreude, car crash blogging, or perhaps some material to share with your crazy crypto mates.

I have become quite a fan of margin lending. Just reviewing first of all the journey I’ve taken…

Normal mode: 10% leverage

I first dabbled with margin lending, literally on the margins, about 10 years ago. More recently, about five years ago, I decided to use the lending strategically, and for several years I set my target asset allocation to include approximately a 10% level of margin – i.e. I own assets amounting to 111% of my portfolio value, having borrowed 11% to fund the purchase; the 11% loan is 10% of the total asset value. I consider this level of leverage to be minimal risk, because the dividend yield off such a portfolio will, under auto pilot, pay off about a third of the loan every year, even if the markets suffer significant falls.

Two key leverage ratios

For completeness, I should mention the rest of the debt I hold. I have a modest level of mortgage debt on investment properties, on a mixture of interest-only and repayment arrangements. These investments generate significant free cash flow, which is mostly used to (over)pay down mortgage principal. I have no other significant debts. Unless otherwise stated, I ignore the mortgages when talking about my leverage level.

In terms of affordability ratios, in normal mode my total loans (including mortgages) amount to about 4x my income (including investment income), and about 10% of my net worth (including properties). Nothing here that would give my bankers too much trouble.

Unorthodox procedure 1: buying House 1

A key moment for me was when I took a large risk in 2016 by buying my Dream Home with a margin loan. I pushed my Loan To Value temporarily up to almost 40%. To be fair the Value here wasn’t my entire household net worth, it was only my own liquid portfolio, but it was still a level of leverage that could have caused me trouble. Fortunately, for a reason of anticipated reasons (windfalls I was expecting) and unanticipated reasons (Brexit hitting the pound, which reduced the value of my loan against my global portfolio) and the extended stock market boom, I never looked back from that initial high level of leverage, and four years’ later I had my leverage back down to 10% again.

It is worth highlighting the simple arithmetic behind my leverage fall from 38% to 10% over four years. Falling from 38% to 10% is a drop of almost 75%. And indeed during that time, my loan shrank significantly, but ‘only’ by 55%. At the same time my gross assets increased in value by 51%. The combination reduced my loan as a % of total value by ~75%, to 10%. Rising markets hide naked swimmers, and they rapidly reduce leverage (which is why we should expect western governments secretly to support inflation for a few years yet).

Continue reading “Life on the margin”