
The end of December 2020. Time to do my monthly review of my portfolio, but also time to do an annual review. It is the end of my eighth year of monthly tracking of my portfolio. And it’s the first year I’ve tracked that has a very serious market meltdown in it, triggered of course by the covid-19 pandemic.
While I am somewhat geeky unusual in the attention I pay to my portfolio, it is general good practice even for ‘normal people’ to review their finances and investments on an annual basis. In the spirit of trying to be helpful, I’m setting out in this post to tackle seven generic questions that I think all prudent investors should ask themselves at least annually, and where the answers suggest ways to optimise/enhance your outcomes.
Q1 How did ‘my’ markets do?
The first question is ‘what happened out there?’. By ‘out there’ we mean the world we are trying to invest in. If your savings are notes of cash stuck under the mattress, then the answer is somewhere between ‘nothing’ and ‘I don’t care what happens in this game, I’m not playing’. For the rest of us, our investments are seeking a return – and the first question is ‘what returns were available?’. If you are in Australia, investing only in Australian equities, then the answer will be different to if you are in Germany, investing mainly in German bonds.
In December?
I won’t dwell on a single month in this post, but here are the figures, in the markets that I’m in:
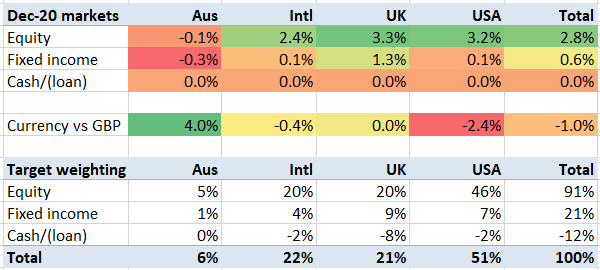
Australia saw a boost to its currency as it emerged from lockdown. The European & American stock markets were lifted by general optimism around vaccines, and a UK/EU (thin) trade deal. The pound and euro strengthened against the dollar. UK bonds rose a bit too, presumably reflecting avoiding a disruptive ‘no deal’ outcome. Not a lot else to say.
In 2020?
This left the year as a whole looking as follows:
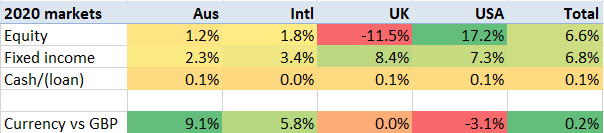
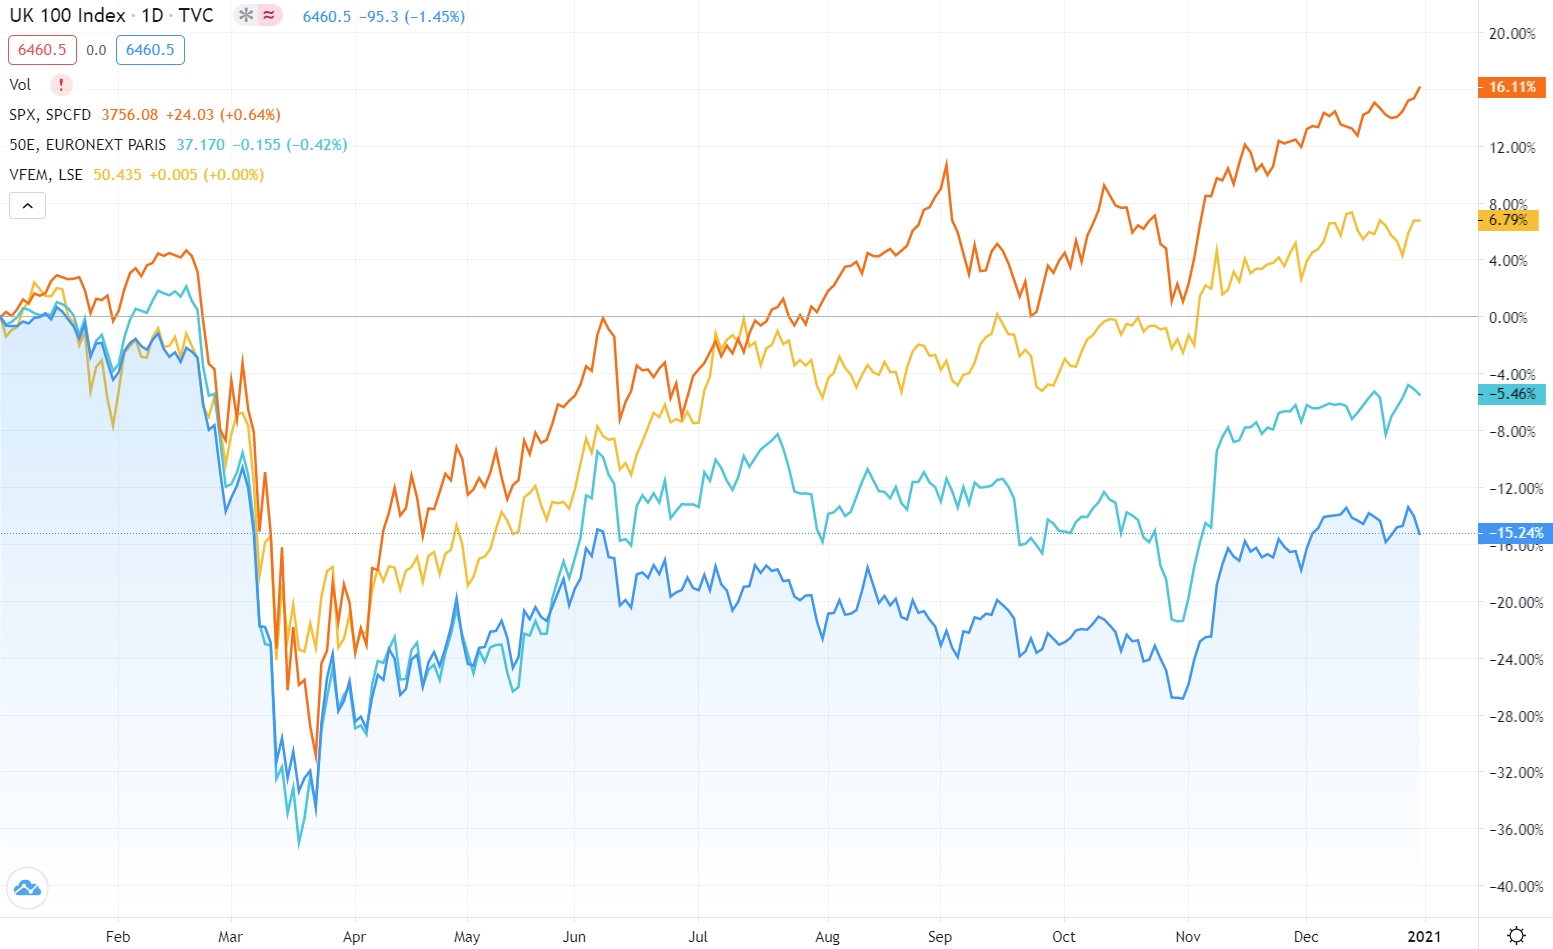
The year saw a lot of action in equities, kicking off in February with the most dramatic stockmarket crash ever – in speed of fall terms. The main markets dropped by over a third in about a month. But since then we have seen a steady recovery, leaving the S&P500 up 16%, and FTSE-100 down ‘only’ 15%. Dividends improve all these numbers by a bit too. And for completeness (thank you @ Simon Apperley!) the UK’s small/midcap FTSE-250 ended the year roughly flat, somewhat ahead of FTSE-100.
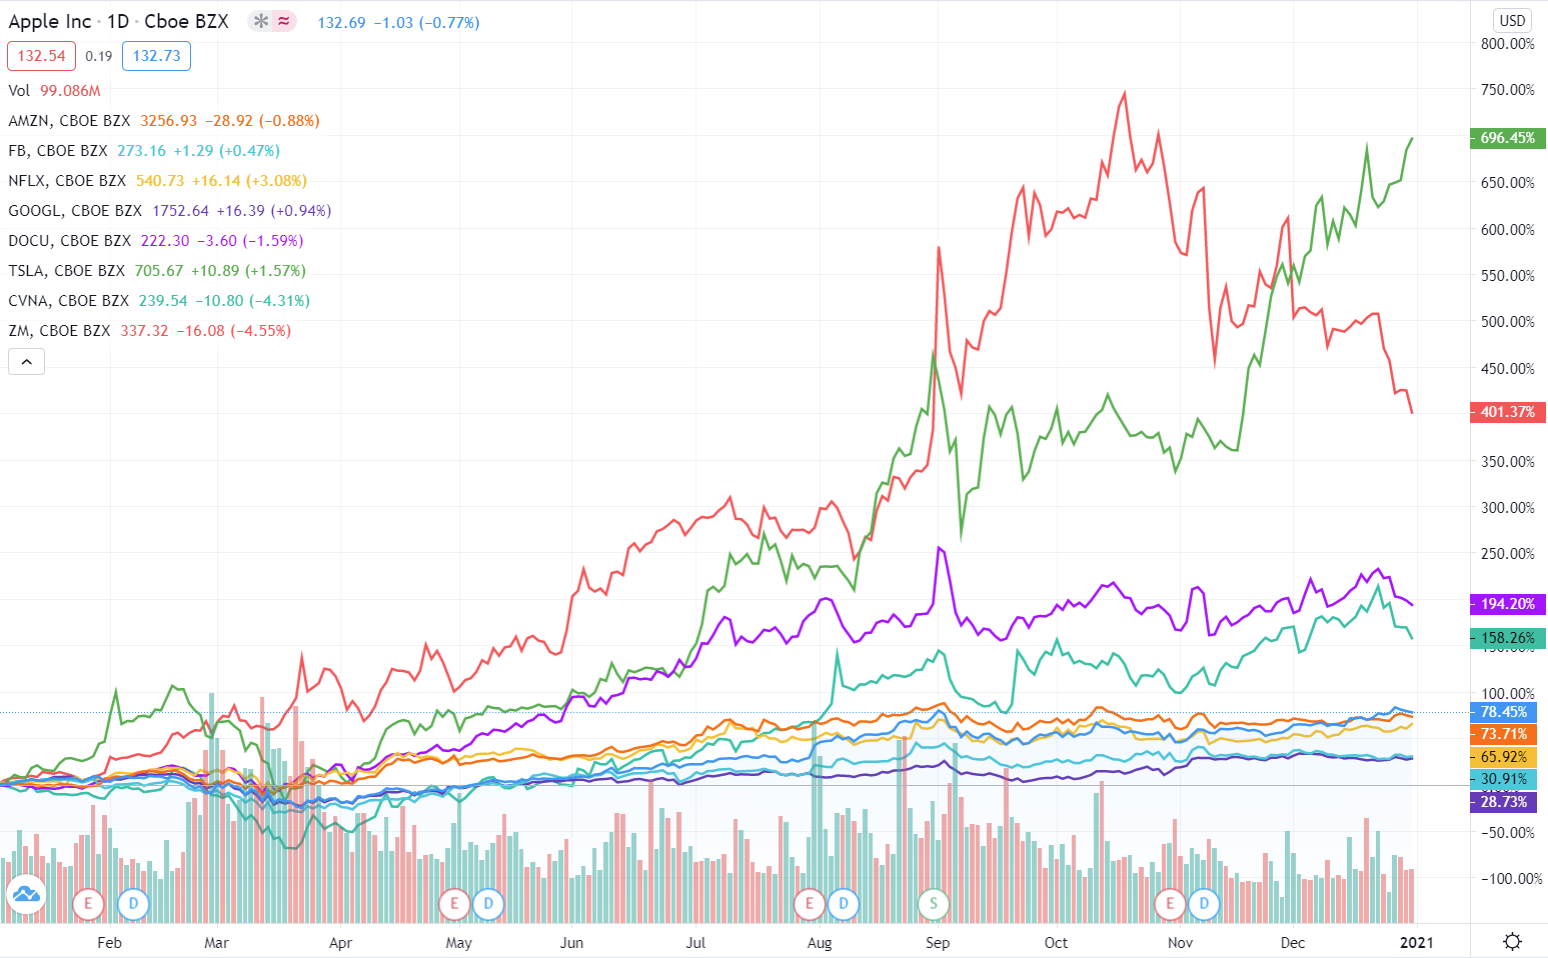
The two key factors explaining these outcomes appear to be covid-19 and tech stocks. The emerging markets are dominated by Asia, which has had the best recovery from the pandemic. Whereas the European/American economies have been reeling from the impact of lockdowns. America however has the main public tech stocks, and tech has done very well out of working-from-home. This can be hard to see when you look at the big stocks like FAANG. Those pedestrian-looking lines in the chart below are Apple, Amazon, Netflix and Google posting far-from-pedestrian increases of 28-78% (!). But there are numerous multibillion dollar stocks that have done far better – e.g. Tesla, Carvana, Docusign and, obviously, Zoom.
This disparity between US and UK stock markets sets the scene; for UK-orientated investors, 2020 probably saw a fall, whereas global-orientated investors should have seen their investments rise, with the US having 15x the weight of the UK in global stockmarkets.
The other markets that we are all in, consciously or otherwise, are currency markets. Here the standout performer among ‘my’ major currencies was the AUD; at the start of the year the pound bought almost 1.9 AUD, whereas now it buys only 1.76 AUD. The Euro has also gained against the pound, by about half as much. The dollar has had the poor year, falling 3% against the pound. As so often, the pound sits in the mid Atlantic.
Q2 How did I perform vs ‘my’ markets?
Whichever market we’re in will determine what our outcomes should be. The next question is how closely we tracked those markets. If you can beat your markets on a sustained basis, you’re beating the clear majority of the professionals, or you’re not tracking thing properly. On the other hand, if you lag your markets materially, for a significant period, you can improve your performance very simply – by shifting to low-cost index trackers.
In my case, the blend of ‘my’ markets delivered a 7.3% increase. ‘My’ currencies rose by 0.3%. The combination was up 7.6%. My own performance tracker this pretty closely – I was up 8.5% in the year. My eight year record is over 11% per year – significantly above my planning assumptions. My slight outperformance in recent years probably reflects my overweight towards tech stocks – I have significant holdings in Amazon and Google, for instance.
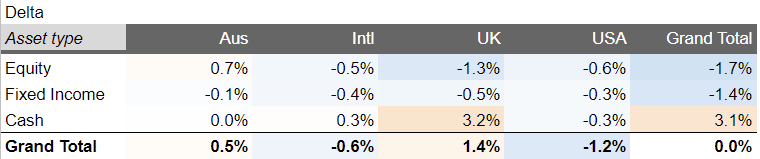
The other measure that matters is how close the actual allocation is to what was intended. If you started with, say, 50:50 US:UK a year ago, the gains of the US market versus the UK would have left your US holdings at 56%, almost a third more valuable than your UK ones. Without taking correcting action, you are not in the markets you wanted to be in. In my case, I have been pruning my allocation almost every week, staying deliberately a little bit underweight on equities and overweight on GBP cash. My year end deltas versus my target are shown below:
ZXspectrum48k pointed out last year how closely my results track Vanguard’s World Equities tracker. This year has seen the same, with the GBP denominated version rising about 9%. Though I have a 21% fixed income weighting, unlike VWRL, I also have a small amount of leverage, which ups the risk level back to – clearly – a similar place to VWRL. I could achieve very similar results a lot more simply by just swapping the whole lot for a large holding in VWRL. Which is not lost on me, believe me.
Q3 How am I doing versus my retirement goals?
I haven’t defined my retirement goals that precisely. Most people should, and would, have a clearer idea of what they need in retirement than I do.
However, the pandemic / lockdown of 2020 makes it very difficult to say how much progress I’ve made towards retirement.
What I can say is that my portfolio is about 7% bigger than a year ago, but my investment income is about 25% below its peak – due to the cancellation/reduction of so many dividends. However my spending has fallen too, with lockdown preventing much of the stuff that I enjoy spending money on – travel and dining out – so I am not even bothering to analyse it for 2020 because 2020 felt so exceptional. My gut says my 2020 income, at its depleted level, could more than cover my spending under most scenarios. I think overall I feel at least as well set up for retirement in Dec 2020 as I did in 2019.
Q4 How tax efficient is my portfolio?
This year saw me complete the sale of my former home, which was not included in my investment portfolio, and transfer the funds (with atrocious timing) into my investment portfolio.
In principle this increase in my investment portfolio will have had a negative effect on my tax efficiency, as the funds have largely gone into General Investment Accounts – not tax sheltered accounts like my pension or my ISAs.
In practice, I moved a disproportionate amount of the funds into Mrs FvL’s accounts, as well as into my Ltd company. Mrs FvL and my Ltd both have lower tax rates than I do, so my tax efficiency hasn’t got much worse than 2019.
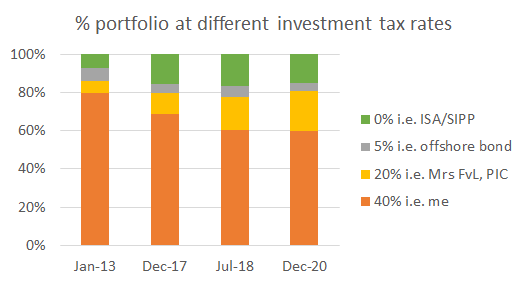
About 60% of my portfolio is in my unsheltered name. But over 15% of it is in tax sheltered pots, and about 20% of it would attract income tax of only around 20%. My blended average tax rate is 31%. This is about 1% more than it was a year ago, and doesn’t feel too bad.
The tax elephant in the room is what happens to capital gains tax, which is 20% right now for me, versus 45% for additional income. The chatter is that the government will increase capital gains tax to much closer to income tax. My analysis doesn’t really take capital gains into account. But in practice I sell relatively little, so I don’t pay much capital gains tax. My total exposure right now, if I sold everything, is a six figure sum; it is conceivable that I would become exposed to a seven figure sum under new tax rates. However I think that would just reinforce my general behaviour of not selling.
Q5 What does my portfolio cost, in cash terms?
The next question is what the fees incurred are. This is a very difficult thing to assess in general, though it has been getting easier thanks to the EU’s MIFID regulations. At the time of writing, the UK still abides by MIFID, and this results in investment platforms sending out an annual review of fees/charges. These are still not the easiest documents to follow, but they definitely help.
However, pensions are not subject to MIFID, and the level of transparency about fees is correspondingly lower. As a result you are probably better off just assuming you pay between 0.5% and 1% of your pension, every year, in fees.
And, boy, how these fees add up. I am paying tens of thousands of pounds a year in fees. It is my single biggest expense, with the possible exception of eating out – which I do a lot of!
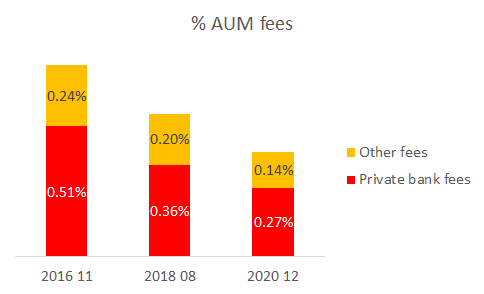
Overall however my total fees, all in, are around 0.41% of my investment portfolio. Two thirds of these fees are my private banking fees, where I am paying 0.83% of the assets held with the private bank, but since my private bank now has less than one third of my portfolio, these don’t distort my figures too badly. For my non-private-bank assets, I am paying 0.21% of the asset value – very close in fact to VWRL’s 0.22% fee level. Overall my fees have almost halved over the last four years, partly thanks to some conscious streamlining and partly due to the increases in my portfolio all escaping the clutches of the private bank.
Q6 What does my portfolio cost, in time terms?
I wrote, at the start of this year, about the complexity of my portfolio. And I resolved to do something about it. I described how I had typed in over 1800 transactions for 2019, 500 of which were dividends of less than £50, and how my tracking spreadsheet had 570 rows in it. I did quite a major cleanup in Q1 2020. What has been the impact?
Well, I should start with a disclaimer that the dividend drought since March this year makes it hard to be confident in my figures.
I also have to concede that my anti complexity drive left me with a great deal of complexity in Q1, not to mention also realising some significant capital gains. I had 800 transactions in Q1 alone – largely due to my efforts to simplify my unwrapped portfolios, and move single equity holdings into wrapped portfolios. So my total transaction count for 2020 is, erm, almost 2000, up over 100 since 2019.
However, looking at Q2/Q3/Q4, my transaction counts have dropped from about 500 to less than 400 a quarter. This is progress. And in fact for my unwrapped holdings, I am down from about 200 a quarter to about 150 a quarter. And the accounts which land with my accountant have seen the figures fall by about 40%. My main tracking spreadsheet now has 490 rows in it, but it includes about 50 new rows for a specific reason that is outside the scope of this blog.
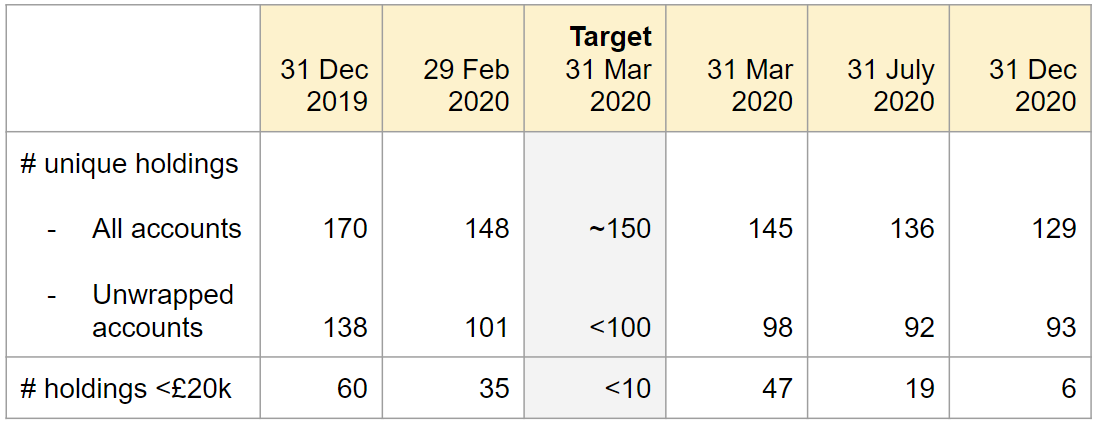
My number of unique holdings has dropped from 170 a year ago to about 130 now, and my holdings in unwrapped accounts has fallen from 138 to 92. These drops represent not just a reduction in transactions to log but fewer things I have to clutter up my head with. I still have a couple of holdings that I would struggle to tell you more than a tweet about the company, and thus I probably shouldn’t invest in.
Most pleasingly, my number of small holdings (<£20k value) has dropped from 60 to 6. Of these 6, 4 of which are in my High Yield Portfolio, which is a perennial mangy dog of a portfolio that I can’t quite stomach putting out of its misery but at least I haven’t increased the size of the portfolio to hit my £20k cutoff.
So all in all, I’ve made a good start but I still have a long way to go. I hit my complexity targets in Q1, but didn’t hit my materiality targets until the last couple of months.
Yet I can’t duck the observation that, versus just holding a few million quid of the VWRL ETF, I am incurring enormous time/hassle costs. I need to improve this unflattering comparison.
Q7 What key risks am I taking?
The last question on my list is about risks.
Risks are difficult things to assess. But from a generic point of view the big ones many people expose themselves to include: running out of money, losing a job/income stream unexpectedly, divorce resulting in the ex running off with ‘my’ money (warning: fallacies at work!), unanticipated health costs, and so forth. In my case I think I am relatively alert to these risks and relatively well protected against them.
From an investing standpoint, the most obvious risks are being either under or over exposed to the markets. Those of us with high tech exposure feel vulnerable to a sharp correction. Whereas investors (not many of my readers) with conservative investing preferences have probably missed out on very significant opportunities in the last two years, but now doesn’t necessarily feel like a good time to dial up the risk appetite. Overall, in my case I think I am managing this one OK – overexposure is my key risk and I think every year of gains helps reduce the risk to ever lower levels.
I worry about fraud / theft / corporate failure. The most damaging of those would be something like my bank going pop, or Vanguard going pop, or somebody somehow impersonating me across multiple account providers. I don’t think any single issue could hit me for more than 25% of my wealth, though obviously if issues compounded that could get worse.
I still have the Living Will on my to do list. In fact literally the paperwork has been in my inbox for a couple of months now. Must get that sorted before next year’s write up.
Conclusion
All in all, it has been a very unusual year in the markets. My portfolio has seen some of the biggest moves in its tracked history, but has ended up almost 9%. This is despite quite a significant simplification of the portfolio, while retaining tax efficient arrangements.
There is plenty for me to think about as we head in to 2021. Chiefly, why do I still have over 100 holdings in the portfolio, when my returns mirror one security – the global equity tracking ETF VWRL – so tightly? More work on that front is required.

I like the way to approach this going through questions.
For your readers that would like a snapshot of the past decades I did a summary here:
https://bankeronwheels.com/historical-market-returns/
Happy new Year!
LikeLike
The VWRL comparison is valid but don’t you enjoy the process of (active) investing?
Would you rather do something else with your time?
Also, is the comparison risk-adjusted?
LikeLike
Michael – I do enjoy (active) investing but don’t like the thought that all that time spent is wasted! And I am pretty sure I would find something else for the time. In any case, I will do a fuller analysis of me vs VWRL, looking at risk-adjusted comparisons among other things, but my gut tells me that my returns and risk profile are very close indeed to it.
LikeLiked by 1 person
Thank you for writing this. Very insightful. After all would just investing in index fund be more efficient? 🙂
LikeLiked by 1 person
Thanks for sharing, intriguing as always. As someone who recently (18 months ago) simplified my portfolio into three holdings: 1 VWRL seven figures, 2 MSFT six figures, 3 Vanguard Global Bònd six figures. I find myself reading about your complexity and not feeling jealous one bit. So the question is, why do you dislike VWRL (or similar global tracker) so much? You mention the comparison several times, what is stopping you making the change? That is afterall what reviews should lead to e.g. insights, and change. Interested in your thoughts best wishes R
LikeLiked by 1 person
Bob
Many thanks for your question. Well, I am asking myself that question at the moment. A few factors are on my mind. First of all I think my active investing just about ‘earns its place’ – can I prove that to myself? Secondly the fees for VWRL are relatively high – if I were to go index, isn’t there a ‘DIY’ version which would use combinations of e.g. IUSA, VFEM, etc to do it with my own allocation, more cheaply? Thirdly, the capital gains I would realise – creating a high six figure tax liability – though if CGT is due to double then this might be perfect timing. Fourthly, some form of psychological quirk where I rather like the time wasted tinkering, analysing, learning – what would fill the gap? And probably a few more underlying subconscious reasons I am still trying to tease into my consciousness.
Out of interest – why is MSFT your sole direct stock? Did you have a professional connection? It is a stock I rather like but am not sure it would have made a cut of one!
LikeLike
Just an opinion to provoke your thoughts, in response to your reasons; 1) ‘Active investing just about earns its place’ this is unlikely over the long term so its probably more to do with enjoyment, but how enjoyable will it be should you face consecutive years where you don’t beat or match the market. Is the risk/reward worth it? Or can you enjoy yourself equally with less risk? 2) Cost. Well buying indexes are pretty damn cost efficient, relatively. Sure you can add some complexity if you wish to cut out some further fractions of a percent. I ask you, is this really a reason not to replace your sprawling / complex possibly riskier portfolio for a global tracker or two? 3) CGT implications of transition for subset of portfolio outside wrappers. This seems to be the first genuine concern. However, it will have to be addressed at somepoint in time unless you never ever sell. As you point out now may be a better time, or should you decide to, a gradual shift could offer an attractive strategy. 4) ‘I rather like tinkering etc’ Of course, by all means, but do it with a small subset not the entire portfolio. Enjoy the process and learning without the risks. I write this not as some expert, nor some all-knowing master, simply to help provoke your thought process. My MSFT holding are a legacy of participating in an esop scheme and I’m happy to hold the remaining units. Best wishes R
LikeLike
Good points – well made.
I am more in the mindset of evolutionary change, towards an aspirational goal, but bit by bit. Focusing initially on the tax reportable accounts. I have been doing a bit of work today and think I do have a case to continue some active investing, at least in the areas that I know best – but that leaves me with plenty of simplification still to do. I may yet post a blog post on this theme – thanks for the stimulation.
LikeLike
How do you measure your portfolio return? (which you say is 9% this year)
I am asking because I am trying to do this for the first time this year but I find it difficult to calculate with all the deposits and withdrawals in my account. I found out about something called the Time Weighted Return – is that what you use for your return for the year?
LikeLike
Simon – you need to ‘unitise’ your returns – see these posts for more details / worked examples:
1) https://firevlondon.com/2017/01/17/my-investment-tracking-spreadsheet/
2) https://firevlondon.com/2020/04/11/portfolio-tracking-spreadsheet-v2-0-release-notes/
3) https://firevlondon.com/monthly-returns/
LikeLiked by 1 person
Active vs passive is an interesting conundrum considering your wealth. Even 1% extra is a significant amount not to be sneezed at. But is it money for money’s sake and you end up at risk of being the richest man in the graveyard. To my uneducated eye, getting that retirement goal (or any other goal your money delivers even if it is that lifetime membership of your gentlemans club ;)) in place is perhaps a prudent next step. Unless you truly love being active in which case I wouldn’t fight it.
LikeLike
Very interesting and well presented, prompts questions about one’s own portfolio.
Interesting the thought about going all in on VWRL ( simple alternate is 9 parts VEVE to 1 part VFEM much cheaper and still simple) I am moving away from nearly all in on the All World tracker to add a few investment trusts plus Berkshire and Brookfield. The all world tracker has been doing great on the back of a large holding in the US market and a concentration on large caps wit dash of momentum and is a very popular approach, regarded almost as a no brainer… that raises a red flag.
LikeLike
look out for upcoming blog post on this v topic!
LikeLike
Have you considered putting 100% (or close to) into VRWP (accumulating) as opposed to VWRL (distributing)?
Could use a platform like Hargreaves Lansdown – get all the great service, support, slick website, etc. for only £200 per year
Would save a huge amount of time – and probably a little £££ too
LikeLiked by 1 person
No, I haven’t. That’s an interesting idea – thanks. I will do some digging….
LikeLike
[…] I’m following the same structure I’ve used for the last few years (2022, 2021, and 2020). Overall, 2023 was a good year on almost all measures – thanks in particular to Q4 which […]
LikeLike