
This post is a sequel to my Investment Tracking Spreadsheet post of three years ago. A number of readers have found the spreadsheet (‘example portfolio returns tracker’) outlined in that post helpful, so it’s time to bring it up to date.
Since I wrote that post I have in fact been using a Google Sheet as my ‘day to day’ portfolio tracking tool, which gives me live prices on most of my holdings. My tracking Google Sheet uses the very same FIRE v London example workbook as its master ‘database’, so the security data (tickers, expense ratios, etc) is updated fairly regularly.
I have taken advantage of the long Easter weekend to release an updated public share tracking spreadsheet (here) which supports live prices. The difficult bit is that it handles both equities (via GoogleFinance) and also funds (as listed on Hargreaves Lansdown).
The spreadsheet is still read only, but you can make a copy (either download a copy in Excel, or make a copy in Google Sheets) to edit yourself and make your own portfolio tracking tool. All appropriate disclaimers apply – use at your own risk.
Full release notes are as follows:
- Updated statement formats.
- ii / TD have now integrated their platforms. I have removed the TD input sheet and the ii sheet now uses their latest format (in fact the old TD format).
- EQi is the new name for Selftrade. Their downloadable format has changed too – I have updated the input sheet.
- Fidelity have updated their download format – this is updated.
- Live share prices.
- The sheet uses GOOGLEFINANCE() to pull in live prices for equities. Googlefinance tickers are by default USA tickers, but it supports other exchanges too with the appropriate prefixes.
- I lean on Hargreaves Lansdown for Fund prices. This is something of a hack, and HL’s website does not always play ball. But it is a lot better than nothing. Note that I tend to use Income units, not Accumulation units, so my ‘ticker’ is usually the Income version.
- Google/Hargreaves use arbitrary, and inconsistent units – between pounds and pence in particular. There is a ‘scaling factor’ for each security that corrects this for; usual values are 1, 0.01 or 0.0001. There is a manual hack for when holdings appear to be too large – above the max_unscaled parameter, set on the ‘0: Forex / assumptions’ tab (currently £100k).
- As live prices are somewhat unreliable, the spreadsheet falls back to the downloaded statement valuation if it has to.
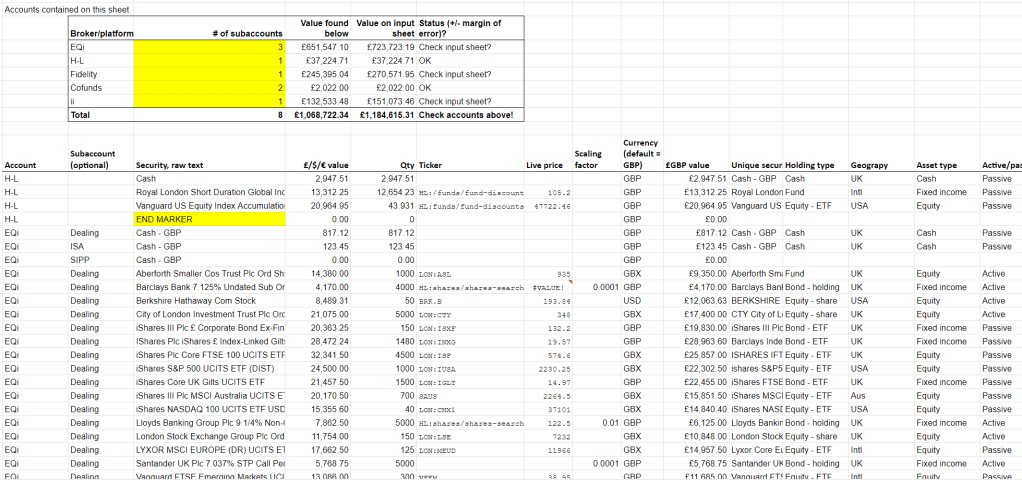
- The status check on the master tab (‘3: Integrated – live’) now works slightly differently. It used to check that the master sheet corresponded exactly to the various input sheets. Now it flags where the discrepancy between the master sheet (with live prices) and the input sheet exceeds a margin (currently 2.5%, set on the ‘0: Forex / assumptions’ tab).
- FTSE-100 index over time, in the ‘over time’ tab, is now pulled in automatically via GoogleFinance.
- The returns tab (‘5: Returns’) now shows returns up to the penultimate row – i.e. the latest ‘historic’ datapoint. This ignores the current, live data which is often (e.g. on weekends) not valid.
- There is some additional meta data for most securities, which attempts to categorise securities into Monevator’s TA’s typology of tax status (from a UK resident’s point of view). I haven’t found this that helpful but in case you do, enjoy.
Many of these updates are visible in the screenshot below, taken from the ‘3: Integrated – live’ tab:

That’s all very well but your spreadsheet is backward-looking. It’s a forward-looking one I want. Get on with it, man!
LikeLiked by 1 person
Impressive effort and I’m sure there are many hours of love and care gone into it and thanks for sharing it. I spent a long time working on a similar endeavour a few years ago, before biting the bullet and signing up to Bloomberg primarily for portfolio tracking. I’m sorry to say, it was only when I really dug deep into it I realised how inaccurate my excel version was. As a single example, to get real accuracy you have to account for a dividend on the day it goes XD. The difference I found from that one small error I was making had a massive impact on the difference to the real return. And that is just one example of many that all contribute to a major difference to a real return. For most people this kind of obsession with detail is ridiculous, but it is worth noting that from the work I have done most peoples estimates of returns are actually far from the reality.
Best wishes,
LikeLiked by 1 person
Fascinating, thanks for your reply Paul. My version reconciles to the period statements I get, so frankly that is accurate enough for me (and I am pretty sure, 90%+ of my readers). I always figure that if my month end numbers are a bit off /stale (/spiky due to XD issues) then that will catch up the following month. The thing that really matters is having my Quantities up to date, which I am pretty hot on. And with over 7 years’ track record the odd bit of daily turbulence is smoothed out.
LikeLiked by 1 person
Pretty impressive sheet. I have something much simpler in Google Sheets.
I notice you are using IMPORTXML to get the fund prices from HL. I used to do this, but I found this often failed to load the fund prices due ta Google restriction. I now use a Google Sheets script to do this, and it seems to work better. Might be worth trying if you have the same problem.
LikeLike
Never heard of those… I will do some reading. Thanks for the tip!
LikeLike
// hl_price function to extract share prices for OEIC / UT from Hargreaves Lansdown webpage
//
// Created because google IMPORTXML function wasn’t loading
//
// See the following link for a problem description
// https://support.google.com/docs/forum/AAAABuH1jm0YMhLzXEfwkI/?hl=en
//
// Code obtained from
// https://stackoverflow.com/questions/39014766/to-exceed-the-importxml-limit-on-google-spreadsheet/48483734#48483734
//
// Also see following link for a slightly different approach using xml instead of regex to get the price
// https://stackoverflow.com/questions/41253339/trouble-with-importxml-on-google-sheets/41275946#41275946
//
function importRegex(url, regexInput) {
var output = ”;
var fetchedUrl = UrlFetchApp.fetch(url, {muteHttpExceptions: true});
if (fetchedUrl) {
var html = fetchedUrl.getContentText();
if (html.length && regexInput.length) {
output = html.match(new RegExp(regexInput, ‘i’))[1];
}
}
// Grace period to not overload
// Utilities.sleep(1000);
return output;
}
function hl_price(url) {
// regex regular expression to extract the bid price
// HL price looks like this
// Sell:30,056.71p
var bid_price_regex = ‘Sell:([0-9,]*\.[0-9]+[0-9]+)p’;
// Grace period to not overload
Utilities.sleep(100);
return importRegex(url, bid_price_regex);
}
// test function – run with Run->Run function->run_test, then look at View->Logs to see output
function run_test() {
url = “https://www.hl.co.uk/funds/fund-discounts,-prices–and–factsheets/search-results/v/vanguard-global-small-cap-index-accumulation”
Logger.log(url);
price = hl_price(url);
Logger.log(price);
}
LikeLiked by 1 person
Awesome, thanks!
LikeLike
I wimped out and use morningstar instead- the free portfolio tracker actually seems ok- although they recently changed the layout for mobile and it barely works at all. I suppose it stops me looking at it all the time now though.
LikeLiked by 1 person
[…] Portfolio tracking spreadsheet: v2.0 release notes [Tool] – Fire V London […]
LikeLike
After rebuilding my own portfolio tracker ‘stealing’ some ideas from yours, which was much appreciated. I now have the ability to track and update my portfolio at the click of a button. Can your provide the rational behind your calculation of the Sharpe Ratio with
=12/sqrt(12)*average(‘4: Over time’!V8:V59)/stdevp(‘4: Over time’!V8:V59)
How does this pull in the returns for lowest risk returns? Or is it some kind of simplified Sharpe Ratio.
LikeLike
Hi Robert. My Sharpe ratio is annual, and simplified to the extent that I am ignoring Rf, the risk-free rate. If you research converting from monthly returns to annual you will see that the formula is basically multiple by sqrt(12), which is the same as multiplying by 12 and dividing by sqrt of 12. In essence you get from average monthly returns (R) to annual annualised by multiplying by 12, and you get from monthly standard deviation (V) to annual standard deviation by multiplying by square root of 12. Formula is R/V.
LikeLike
Hi,
Lovely piece of work, very well structured, thank you.
With iWeb having great transaction prices and HSDL also using the same format, is there any hope that you will support those providers with tabs? I can supply the format of their export if you like, or you can walk me through how to integrate. Thanks!
LikeLike
I have amended the google sheet to scrape the prices from Morningstar, but Googles support for XMLImport is throttled so it is proving unreliable. How do you get an export from iWeb?
LikeLike
For iWeb I tend to use the print friendly format, you then paste into excel/sheets with it looking like the other providers.
Columns:
Company Holding Avg Cost Book Cost Latest Price Valuation + / – (£) + / – (%)
Actually their dealing history pastes rather well straight off the bat, which is useful.
What I am looking for is a spreadsheet that also handles realised gains/losses from sales.
LikeLike
Ah, I am looking for something which will go away and scrape 40-50 prices and insert them into the sheet at the push of a button. If I need to manually got to each page and interrogate it, it will be too cumbersome.
LikeLike
If you post me a sample of the format I will add it.
LikeLike
Mail @ firevlondon.com
LikeLike
Sorry I just saw Andy had helpfully created a script for this. Did you get this working? I get “TypeError: Cannot read property ‘1’ of null (line 21).” when trying to get results from hl_price()
LikeLike
After further debugging it looks like the Regular Expression is pulling back no results as the line including html.match(new RegExp(regexInput, ‘i’))[1]; is returning null. Are you still using bid_price_regex = ‘Sell:([0-9,]*\.[0-9]+[0-9]+)p’; for HL?
LikeLike
Seems to have changed since I left this comment. This is what the regex currently looks like.
// regex regular expression to extract the bid price
// HL price looks like this
// Sell:30,056.71p
var bid_price_regex = ‘Sell:([0-9,]*\.[0-9]+[0-9]+)p’;
LikeLike
Ahh, I see the problem now, unfortunately the html tags that are in the regular expression get stripped out by the commenting system here. Will look at this again tomorrow.
LikeLike
Ah, OK It also messed with the single quotes ” I fixed these to get the code to run.
LikeLike
Well that the same as I have and the same in the code snippet above? And I assume this is working for you? I needed to change the test URL to url = “https://www.hl.co.uk/funds/fund-discounts,-prices–and–factsheets/search-results/v/vanguard-global-small-cap-index-accumulation”;
But when I examine the HTML returned it contains no Sell: information so I assume this is why the match is returning null.
So is this working for you with HL today? I can’t think what else I could have missed.
LikeLike
You should be able to copy the hl_price function from here
https://pastebin.com/ww2fL1zy
The function is currently working for me
LikeLike
Thanks, working now. I just need to refactor this into my sheet.
Much appreciated.
LikeLike
I’m using a version of the FvL spreadsheet (thanks FvL for making it available!) albeit somewhat modified but am having issues when I import from interactive investor. In short, the export function at II works fine but gives me a .csv that when I copy the values across into my spreadsheet gives me a “non-number” (I’d say it imports as text but things “look” like numbers and I can’t see any obvious signifiers that they are text rather than values). So far the only way I’ve found to correct this is to manually re-type the amount that I copy and paste into my spreadsheet but there has to be a simpler / better / automated way to do this. Any help appreciated ….
Thanks!!
LikeLike
@David Have a look at the CSV file with a text editor to see what is going on. I’ve had similar problems when doing other spreadsheet work. You might find all the number values are preceded with a quote character, in which case you can probably do a search and replace or a keyboard macro to tidy things up before you import.
LikeLike
@Andy – thanks. Had a look on notepad and you are indeed right, all numbers are preceded by a “. So as an example (not real numbers) the II .csv output file comes out as:
“Symbol”,”Qty”,”Description”,”Price”,”Change”,”Chg %”,”Market Value”,”Book Cost”,”Gain”,”Gain %”,”Short Name”,”Average Price”
“B3X1NT0″,”250.25″,”VANGUARD INVESTMENT SERIES GLOBAL SMALL-CAP INDEX GBP ACC”,”37,981.45p”,”466.87p”,”1.24%”,”£95,048.58″,”£88,055.12″,”GBP6,993.46″,”7.94%”,”VANGUARD INV SER”,”£310.95″
So using a search and replace to remove the quotes won’t work as you then get the , separator (e.g. between hundreds and thousands) internal to the number values acting as separators and so instead of 37,981.45p you end up with one cell with 37 and the next with 981.45p. Not easy to solve for as far as I can work out! I guess I could try and write a macro (research required – has been well over two decades since I tried such an outrageous thing) to remove all ” and also remove all , which are both preceded by and followed by a numerical character. That might solve it.
LikeLike
Thanks for sharing.
I think the Currency Conversion on the ‘Integrated – live’ tab is going the wrong way.
For example – on your sheet you are showing Qty 50 BRK.B at (todays price) $270.28.
The Forex tab is showing 0.715
50 * 270.28 = $13514 USD
$13514USD * .715 = £9662.51
In your sheet you are showing it as
$13514USD DIVIDED by .715 = £18,900
If I am reading / interpreting it right.
LikeLike
PS. Removing the “1/” from the USD entry on the conversion table on the ‘Forex / assumptions’ table fixed this for me.
LikeLike
Good spot – now fixed! Not sure how long that’s been there, but thanks for letting me know.
LikeLike
[…] mental health nor my portfolio risk management. So I’ve reduced the frequency of checking my live updated spreadsheet to barely once a […]
LikeLike