
I’m not really sure what happened in August.
At least, you’d think something quite significant happened, given that UK equity markets fell over 3% and US markets rose over 4%.
The swing of the US:UK currency itself was notable during the month but over the month fairly minor – with the USD gaining slightly based on 1 August (but the gain having been much bigger only a week ago).
The Australians have joined the Brits, Americans, French, Italians and Swedes in bewilderment at the nonsense their politicians can get up to. But the Australian markets haven’t moved much; the currency fell and the equities rose in compensation.
The USA appears to be making more ‘progress’ on trade, with the news at the end of the month being about some Mexico/NAFTA-related agreement. Maybe that helped. Maybe.
In the UK we saw the media running with the ‘no deal’ ball. How much of this was silly season, and how much reflected the overlooked aspect of the Cabinet’s Chequers deal in which they agreed to take ‘no deal’ planning much more seriously, I couldn’t say. It has certainly nudged me to move my portfolio a bit more out of the UK than I might have done.
So, all in all whatever drove the big market movements in August somewhat passed me by. But 6 point swings between UK and US equity markets, after currency effects, are not common. Thank goodness I have almost double the allocation to the USA – which rose by over 4% – than to the UK – which fell by almost as much.
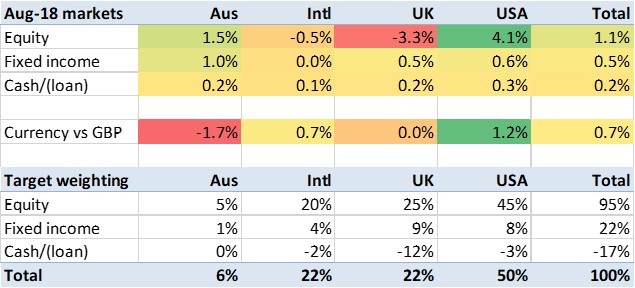
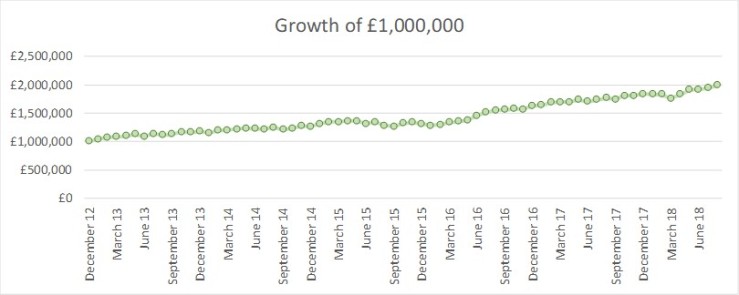
The markets I’m invested in rose, on a weighted average, 1.6% in sterling terms. My portfolio rose by exactly the same amount.
To all intents and purposes my portfolio has now doubled in value since I started tracking it monthly. That calls for a separate blog post.

I love your updates FIRE vs London – they help me understand the portfolio swings I see each month. Oh how I long to live somewhere with a stable currency again!
I am also very glad I’ve not got that much allocated to the UK.
LikeLiked by 1 person
Thank you very much! That feedback is really nice to hear. I struggle with what would make the monthly update more useful/popular so any suggestions would be very welcome.
LikeLike
I’m afraid the monthly update leaves me cold. What I’ve particularly enjoyed are the tales – the DreamHome, the margin loan, …
LikeLiked by 1 person
Come to think of it, what would make the monthly update into a tale? A mighty market crash, rumbling on month after month, I suppose. No doubt one will come along, somewhere between today and, say, April ’21.
LikeLike
Fair enough. I try to flag the updates clearly and not digress too much into ‘tales’. Quite understand not all readers will be interested.
LikeLike
[…] on. There was actually a decrease in my stock values since Julys Savings Report. I’ll let FIREvLondon do the explaining for this one as he’s the expert :] They’ve only fallen by a very […]
LikeLike
I like the updates. I track similar metrics but on a consolidated basis ( 90/10 Equity- cash portfolio). As someone with a significant allocation to global businesses, I try to measure performance in both USD and GBP to ex out the random currency related effects which can make the true performance hard to interpret. Last year the strengthening pound was a major headwind and it seems to have reversed this year.
LikeLiked by 1 person
Just trying to understand one of the figures in your table – how do you calculate the Intl cell in Currency vs GBP row? I have a similar conceptual structure that I use to monitor my portfolio, where I break out FX and MTM movements, but I do this on a contract level, so just curious how you’re rolling that particular figure up, as presumably there’s a number of currencies involved.
Thanks
LikeLike
@grasmi correct. I use EUR as my Intl currency. Increasingly this isn’t quite right esp as I have VFEM as a large holding in this bucket, but Euro holdings are the majority.
LikeLiked by 1 person
Ah right. Yeah, I really like this summary view. As I have the granular positional FX changes in $’s too, I can roll these up and work out a weighted percentage for the regional buckets, but it’s still not perfect though in the case of an ETF which holds underlying assets from multiple currencies (like VFEM as you mention), as depending on which listing of an ETF you choose (e.g. GBP vs EUR vs USD listing of the same ETF), you will get differing attributions of PNL to FX… Not sure there’s a simple solution to that, other than trying to use ETF’s which only focus on assets in single markets and choose a listing in that currency, rather than something like VWRL where it’s going to be impossible to unpick the impact of FX.
Just thinking out loud, but perhaps there’s some value in seeing the change in FX of the listing currency to your home currency too (ignoring the underlying asset currencies) – as it would still be useful to try to unpick the real MTM moves from the noise. I really like this table layout though. Thanks for sharing.
LikeLike
Not sure listing currency matters if pricing is efficient, but haven’t tested that. While you mention VWRL though I now special case that one as it doesn’t fit into my approach nicely. I track it with some shadow holdings which allocate it to each geography.
LikeLike
I think we might be tackling it differently. I’ve got a DB where I enter the regional breakdown in % for each ticker (I just pull these out of the portfolio data from the provider’s website) and use this as a reference when loading the position data in from my brokers. So if I have a position that’s 100k, and the regional breakdown is 20% Eur and 50% US and 30% Asia for the ETF, I’d just split the position value of 100k accordingly based on the percentages. Then I use this regional split of the position value for tracking against my target allocations and to drive my rebalancing.
The listing currency relative to my base currency (which is actually CHF as I was living there when I set all this up) does have an impact for monitoring price movements, but not for target allocations and rebalancing. E.g. if you bought the GBP VWRL instead of the EUR VWRL, and after the pound plummeted, you’d expect to see an offsetting increase in the GBP list price of the GBP VWRL to offset any drop in the pound (the only thing that the GBP drop should affect is any assets that generate GBP in the ETF). So the more I think about this, there’s the listing currency impact you need to offset against price movements, and also the FX impact against the underlying assets (i.e underlying asset currency->listing currency FX swings). I need to give that one some more thought, but I think it starts to get messy.
I’m only currently tracking listing currency base currency, which is useful, as often you see a massive swing (VAS is a good example), but it’s just offsetting a big swing in the currency. The net of these two figures (price+fx to base) is a really useful number. For VAS it’s nice and straightforward, but VWRL / VFEM, etc are trickier.
LikeLiked by 1 person